The Case for Private Infrastructure Equity
Introduction
Infrastructure is the backbone of modern economies. From roads and bridges that allow movement of people and goods to digital networks that enable global connectivity, to energy systems that enable a low-carbon future, infrastructure underpins almost every aspect of economic activity.
For investors, private infrastructure equity is a compelling proposition offering the potential for resilient inflation-linked returns and exposure to structural growth themes playing out over the coming decades.
This paper outlines the case for private infrastructure equity as a strategic allocation in investor portfolios. We argue that a multi-manager approach spanning primaries, secondaries, and co-investments can offer investors the most effective route to capturing value in this expanding asset class.

Part 1
The infrastructure opportunity
Defining infrastructure
Infrastructure assets are the essential physical and organisational structures that enable economic and societal wellbeing. Traditionally, infrastructure has encompassed transport networks, utilities, and social infrastructure.
In recent years, the definition has expanded to include digital and energy transition infrastructure.
Increasingly, many of these infrastructure themes are interrelated and interdependent. For example, the buildout of a data centre must consider digital connectivity, access to an electricity grid connection, and, often, water infrastructure for cooling.
An investment approach that targets the full range of infrastructure themes can benefit from the synergistic impacts of these interdependencies.
|
Communications - Mobile & broadcasting towers - Data centres - Optical fibre - Satellites |
Transportation - Airports - Ports - Toll roads - Rail - Logistics |
|
Social infrastructure - Education facilities - Healthcare facilities |
Energy infrastructure - Oil and gas transport and storage - Hydrogen and carbon capture - Midstream - Battery storage |
|
Utilities - Transmission and distribution - Renewable power generation - Conventional power generation - Water & waste - District heating |
The scale of the investment opportunity
The magnitude of the infrastructure investment gap is striking. Global infrastructure construction activity was USD3.6 trillion in 2025 and is forecast to reach USD4.3 trillion by 20301. However, these spending levels fall well short of what the world requires.
McKinsey estimates that cumulative global infrastructure investment needs will reach USD106 trillion by 2040, spanning energy, transport, telecommunications, and water systems2.
Figure 1: Total infrastructure investment projected through 2040, by sector (USD trillions)

Click the image to enlarge
Source: ‘The Infrastructure Moment’, McKinsey (2025). Note: Figures do not sum due to rounding.
The Global Infrastructure Hub estimates that emerging markets alone require USD43 trillion in infrastructure investment over the next 25 years to support economic development and urbanisation3. Developed markets require a further USD21 trillion to address deferred maintenance, replace ageing assets, and build new capacity4.
Simultaneously, the energy transition, rapid digitalisation of the economy, and shifts in global supply chains are altering the composition and scale of infrastructure demand.
Private capital is playing an increasingly important role in bridging this gap. Private infrastructure equity fundraising grew at a 9 per cent compound annual growth rate from 2020 to 2025, significantly outpacing other private markets asset classes . In 2025, there was a record amount of infrastructure capital raised, with over 58 per cent of year-on-year growth, making it the strongest growing segment across all private markets asset classes5.
Figure 2: Private infrastructure capital raised in 2025 (USD billion)
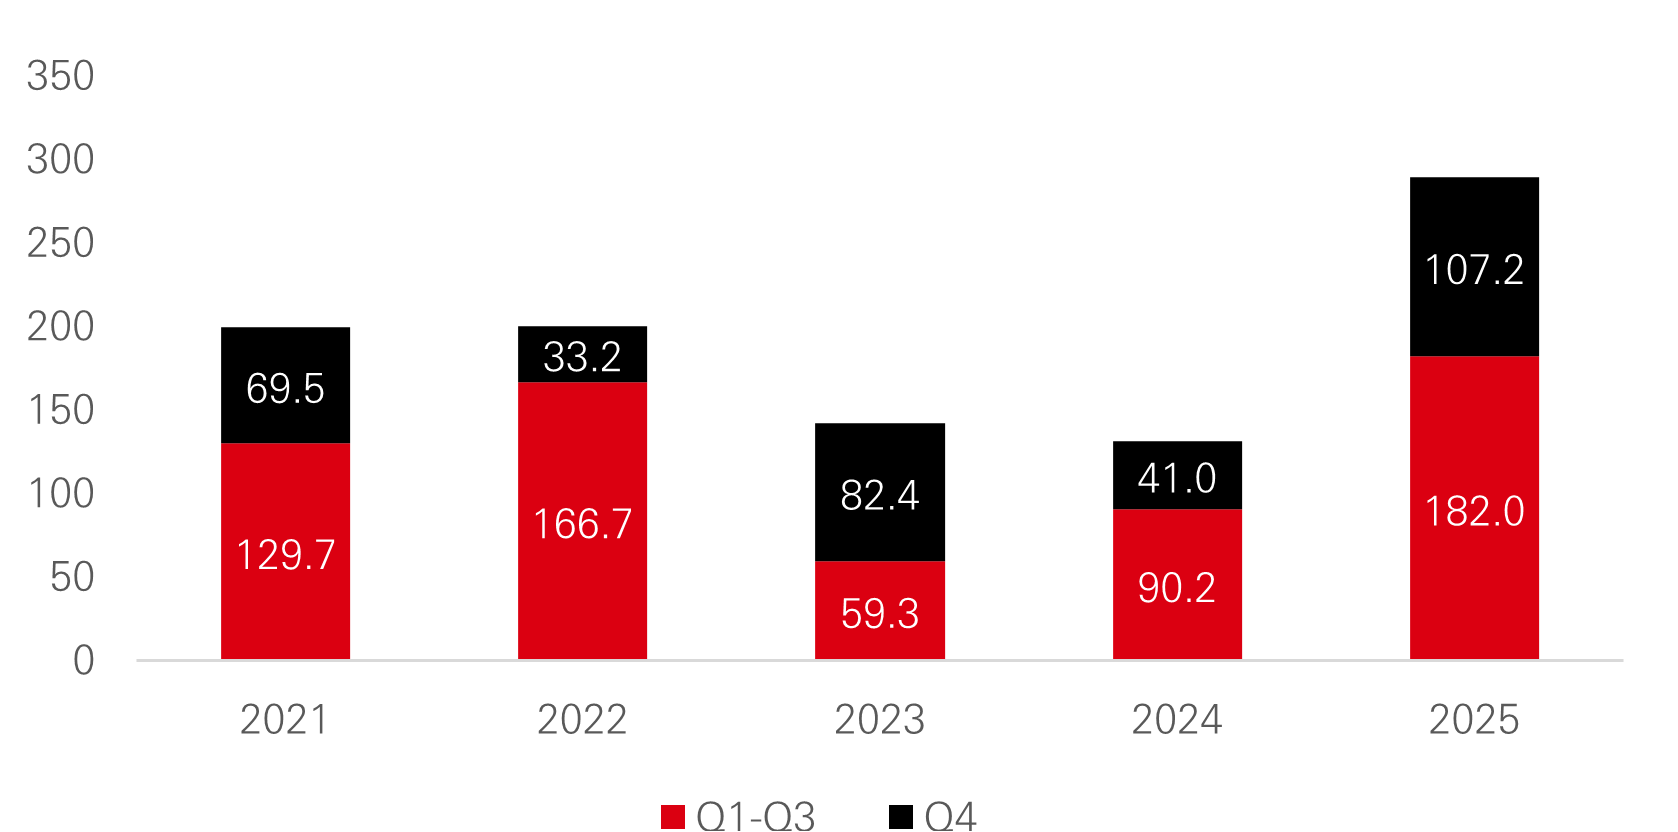
Click the image to enlarge
Source: HSBC AM Alternatives as of Jan 2026. Pitchbook and LCD as of December 2025.
Spotlight on three megatrends
Energy transition
The International Energy Agency (IEA) reports that total clean energy investment (in renewables, nuclear, grids, storage, low emission fuels, efficiency, and electrification) in 2025 was approximately twice the amount directed to fossil fuels6.
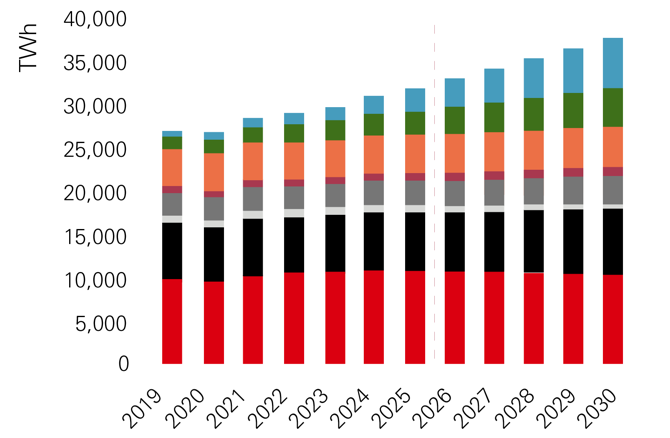
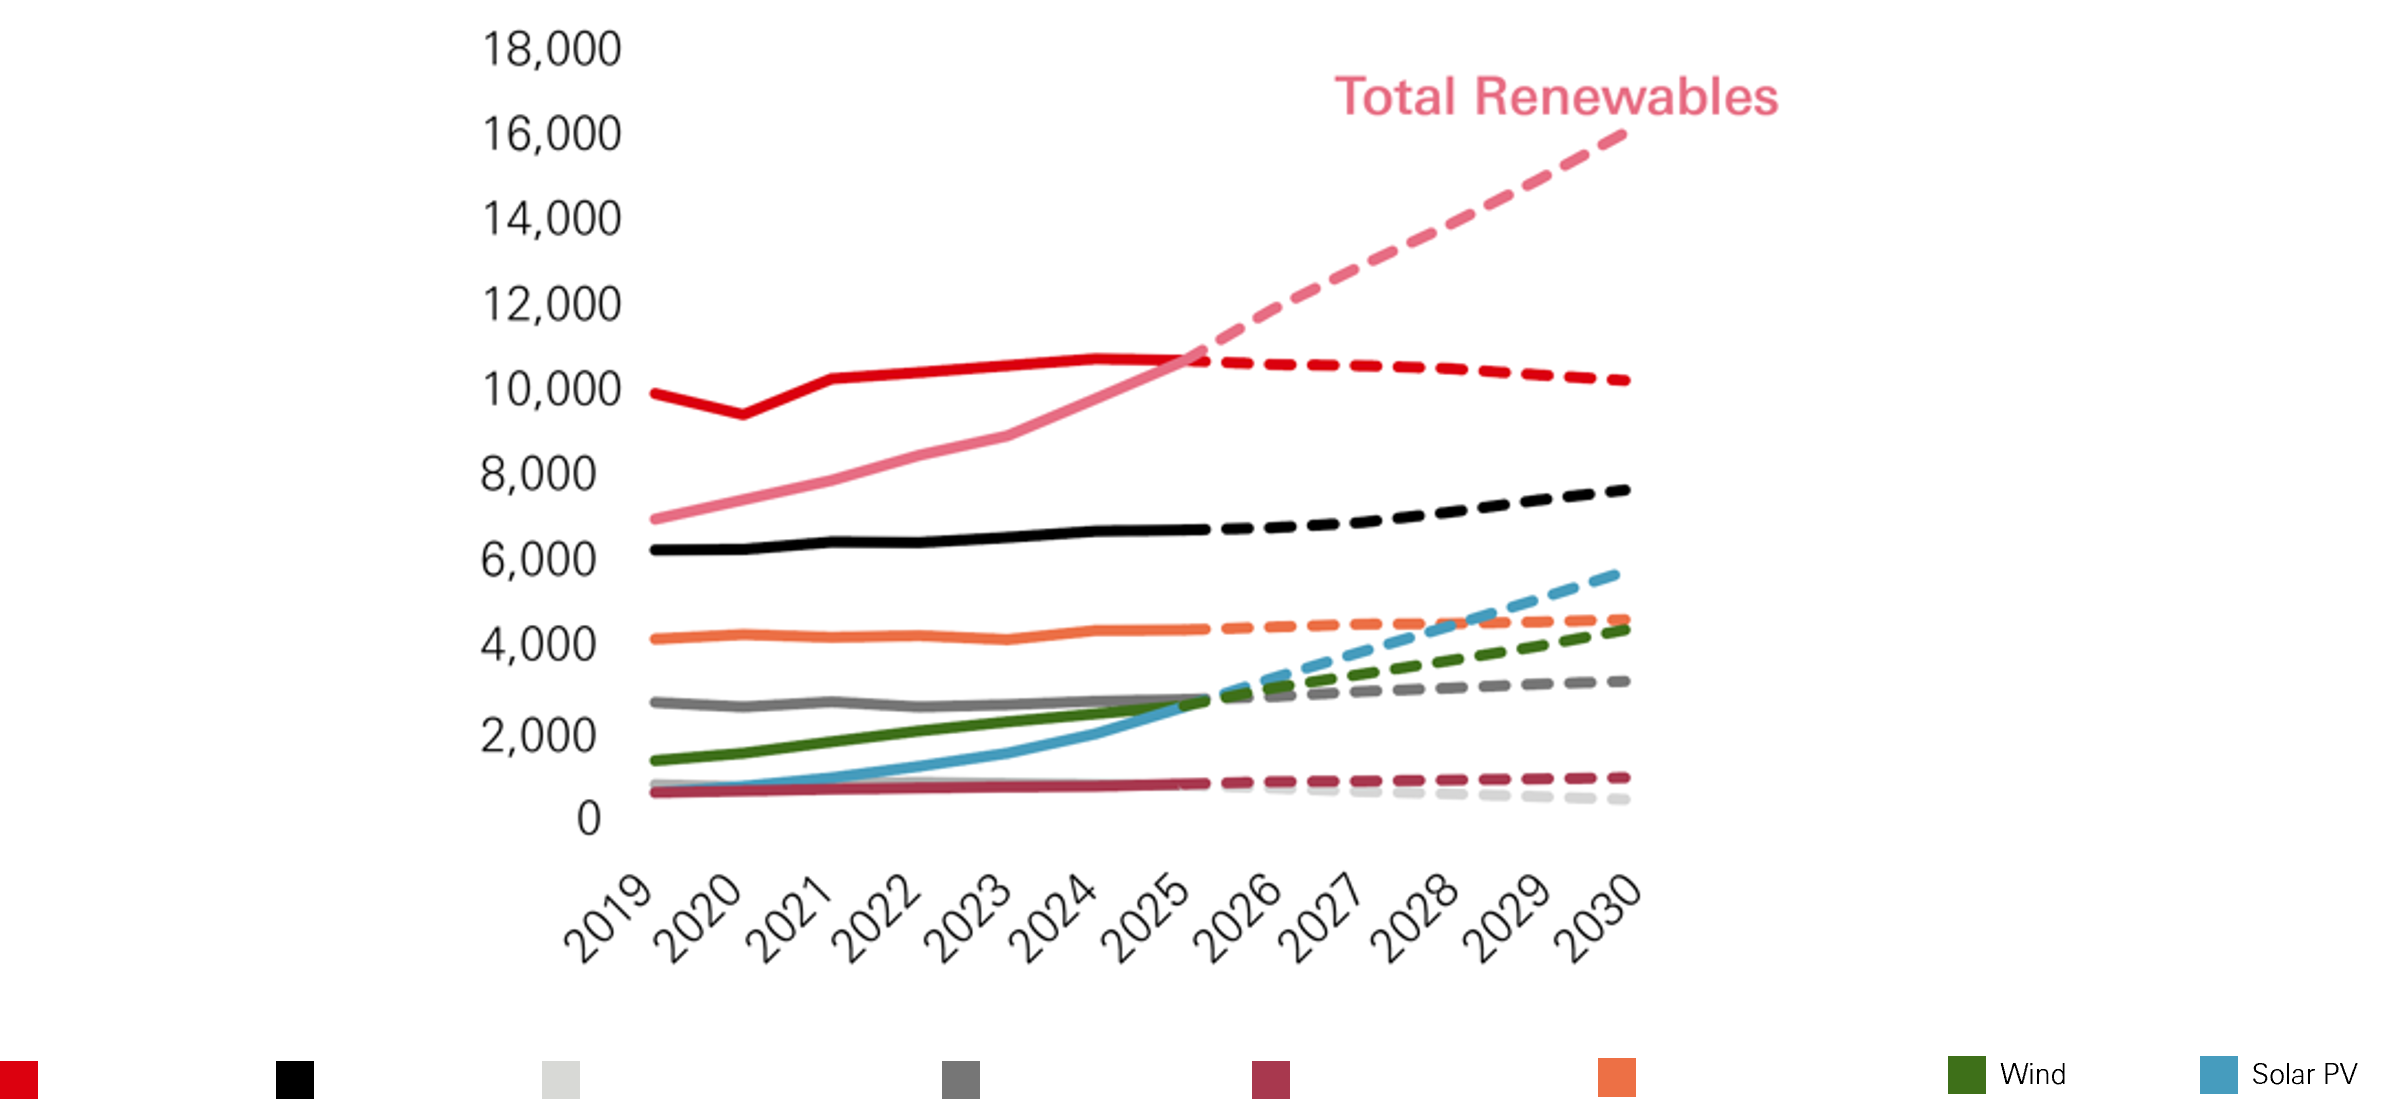
Low-emissions energy sources – renewables, led by solar, and nuclear – will see their share in global electricity generation rise to 50 per cent through 2030, up from 42 per cent in 2025, according to IEA forecasts. Strong growth in renewables and a steady rise in both nuclear and gas output in many regions is expected to displace global coal-fired generation 7
Figure 3: Global electricity generation by source (2019-2030)
Click the image to enlarge
Click the image to enlarge
Notes: RES = renewable energy sources. ‘Other non-RES’ includes oil, waste and other non-renewable sources. ‘Other RES’ includes geothermal, bioenergy, concentrated solar power (CSP), and ocean energy. Data for 2026-2030 are forecast values.
Source: ‘Electricity 2026: Analysis and forecast to 2030’, IEA (2026).
Decarbonisation of the global energy system could represent the single largest infrastructure investment cycle in history. Global energy transition investment reached a record USD2.3 trillion in 2025, up 8 per cent from 20248.
The largest categories of spending were:
- Electrified transport: USD893 billion
- Renewable energy generation: USD690 billion
- Grid infrastructure: USD483 billion
Critically, current investment levels remain well below that required to meet net zero targets. BlombergNEF estimates that annual energy transition investment would need to average USD5.6 trillion per year to 2030 to align with a pathway consistent with the Paris Agreement8.
This gap creates a multi-decade investment opportunity across renewable generation, grid modernisation, battery storage, hydrogen infrastructure, and electric vehicle charging networks.
Many infrastructure funds are contributing substantial investments to develop wind and solar generation assets, since these sources of power have become significantly more efficient, and accordingly cheaper, over the past decade. The disruption to power markets caused by the war in Ukraine and recent conflict in the Middle East has added to the strategic case for investing in local sources of alternative energy.
The Trump Administration’s Big Beautiful Bill Act, together with tariff policy, may result in disruption to the US power investment market, but there remain significant potential energy transition investment opportunities in both North America and Europe.
For private infrastructure investors, the energy transition offers a rich pipeline of greenfield development opportunities and brownfield assets requiring expansion or repowering.
Three key areas of investment opportunity in the energy transition are:
| |
Electricity decarbonisation is supported by investments in solar, wind, battery storage and distributable generation | |
| Electrification of mobility is expanding across public transport and logistics vehicles, providing opportunities in charging infrastructure and fleet leasing | ||
| |
Circular economy development offers an investment opportunity through building infrastructure for waste collection, recycling and distribution | |
Digitalisation and data infrastructure
The explosion of artificial intelligence (AI), cloud computing, and data-intensive applications is driving potentially unprecedented demand for digital infrastructure. Global demand for digital infrastructure assets, such as cell towers, fibre optic cables and data centres, is driven by proliferation of data-intensive devices, the expansion of the ‘Internet of Things’, and online content creation and distribution.
AI model training and inference have become a major driver of the surging investments in data centres9. In 2025, Amazon, Google, Meta, and Microsoft collectively planned more than USD400 billion in capital expenditure, much of it directed towards expanding data centre capacity.
BloombergNEF estimates that data centre investment reached approximately half a trillion dollars in 2025, placing it ahead of total investment in solar energy by value6. Looking ahead, nearly 100 gigawatts of new data centres are expected to be added between 2026 and 2030, doubling global capacity10.
Figure 4: Global data centre supply forecast by region (GW)
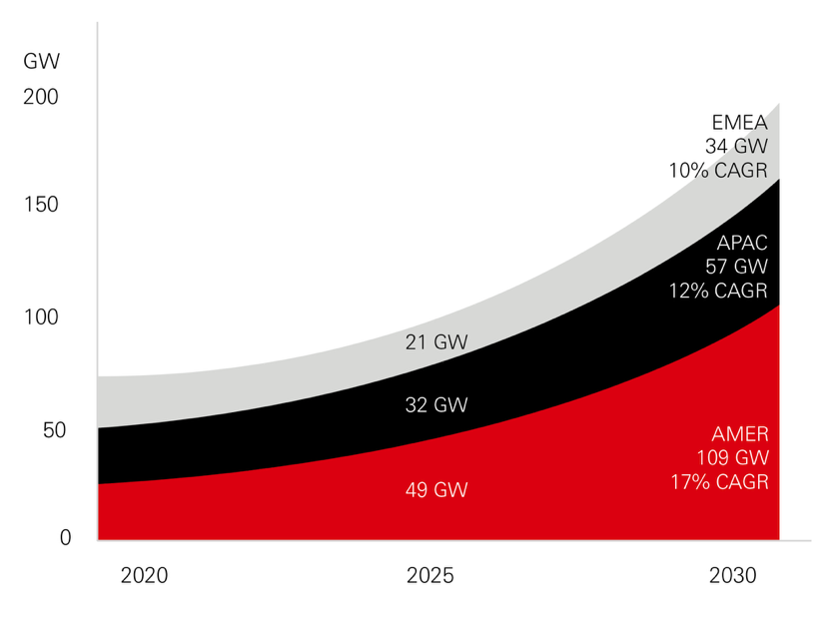
Click the image to enlarge
Source: ‘2026 Global Data Center Outlook’, JLL (2026)
This creates opportunities across the full digital infrastructure value chain, including hyperscale and edge data centres, fibre-optic networks, telecommunications towers, sub-sea cables, and the power generation and grid infrastructure required to supply these facilities.
The intersection of digitalisation and energy transition is particularly noteworthy. Data centres are emerging as one of the primary drivers of electricity demand growth, linking digital infrastructure investment directly to power generation and grid modernisation.
Three key areas of investment opportunity in the digitalisation and data infrastructure sectors are:
| Data Centers address the growing need for more data storage and handling, accelerated by the growth of generative AI | ||
| Power demand has significantly increased in the US. Electricity demand is expected to rise c.2.4 per cent p.a. through 2030 | ||
| |
Telecommunication: offers an investment opportunity through building infrastructure for waste collection, recycling and distribution | |
Growth markets and deglobalisation
The Asia-Pacific region and Latin America economies are shaped by the same megatrends as the developed world. However, they are at an earlier stage of development and lag in roll-out and adoption of infrastructure.
As such, emerging economies are attractive opportunity sets as they generally have rising incomes, expanding middle classes, and rapid urbanisation, which drive significant demand for transportation, energy, water, and digital connectivity.
Asia could receive two-thirds of the total infrastructure investment through 2040, as the chart below shows.
Figure 5: Total infrastructure investment projected through 2040, by region (USD trillion)

Click the image to enlarge
Source: Food and Agriculture Organization; Global Infrastructure Hub; International Energy Agency; International Monetary Fund; Organisation for Economic Co-operation and Development; Preqin; United Nations; World Bank; World Economic Forum; McKinsey (2025)
Given the large populations in these regions, particularly in Asia Pacific, the scale of greenfield construction, brownfield expansion, and renovation requirements is immense. This requirement concerns all infrastructure sectors, including the traditional transport sector.
Furthermore, to achieve a successful energy transition and achieve environmental goals, these countries must replace a substantial amount of coal used for electricity generation with renewable energy. Renewables generation investment in the Asia Pacific region is expected to double to USD1.3 trillion by 203011 .
The chart below shows that the energy transition in the Asia Pacific region generally lags Europe, the UK, and other developed economies.
Figure 6: Percentage share of electricity generation
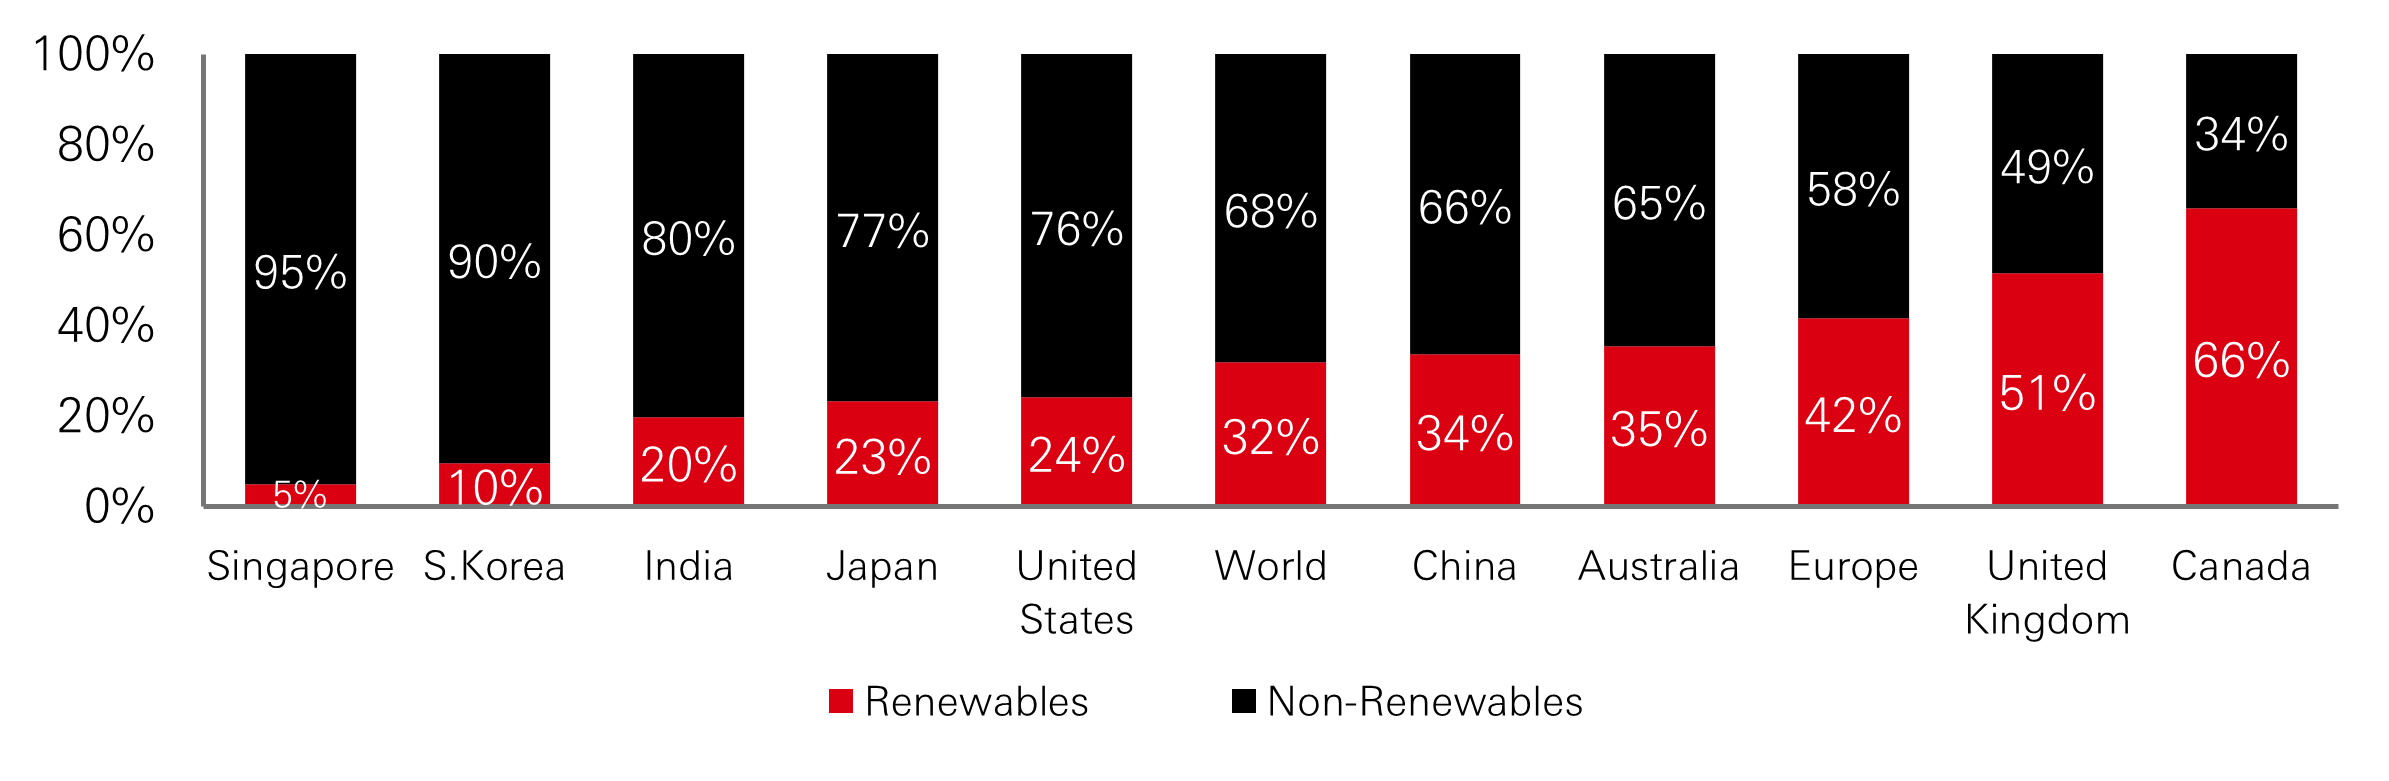
Click the image to enlarge
Source: Ember, Statistics Canada, US Energy Information Administration (EIA), 2025; 1)
Another trend relevant to growth markets is the reshoring of global supply chains, driven by geopolitical tensions, trade policy shifts, and a desire for greater supply chain resilience. This trend is driving a new wave of infrastructure demand in emerging and developed markets.
Nearshoring manufacturing requires new industrial facilities, logistics hubs, power capacity, and transport links. This deglobalisation trend is structural, not cyclical, and forward-thinking infrastructure investors can benefit from future required capital expenditure.
Three key areas of investment opportunity in infrastructure growth markets are:
| Transportation is a traditional infrastructure sector but the density of the transportation networks (for passengers & goods) is still low in many growth markets. | ||
| |
Healthcare services are becoming increasingly important and available to a fast-growing middle class and the overall ageing population. | |
|
|
Digital infrastructure & energy transition: offers an investment opportunity through building infrastructure for waste collection, recycling and distribution | |
Part 2
Allocating to infrastructure
Why invest in private infrastructure equity?
Private infrastructure equity assets have several distinguishing characteristics rarely found in other asset classes that can potentially provide notable benefits to investors.
Figure 7: Key characteristics of private infrastructure equity
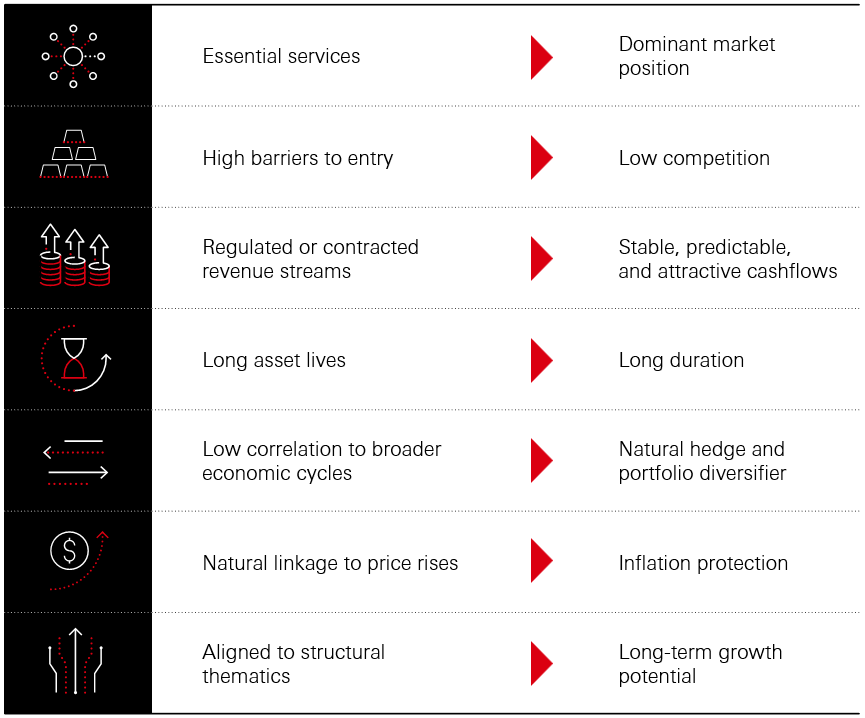
Click the image to enlarge
Source: HSBC Asset Management (2026)
Infrastructure risk-return spectrum
Given the multiple benefits outlined above, how can investors access this asset class?
Private infrastructure equity investing spans a broad risk-return spectrum, from core strategies targeting stable, income-generating assets, through to opportunistic strategies, focusing on development, construction, or turnaround situations.
Figure 8: Risk/return profiles in private infrastructure equity
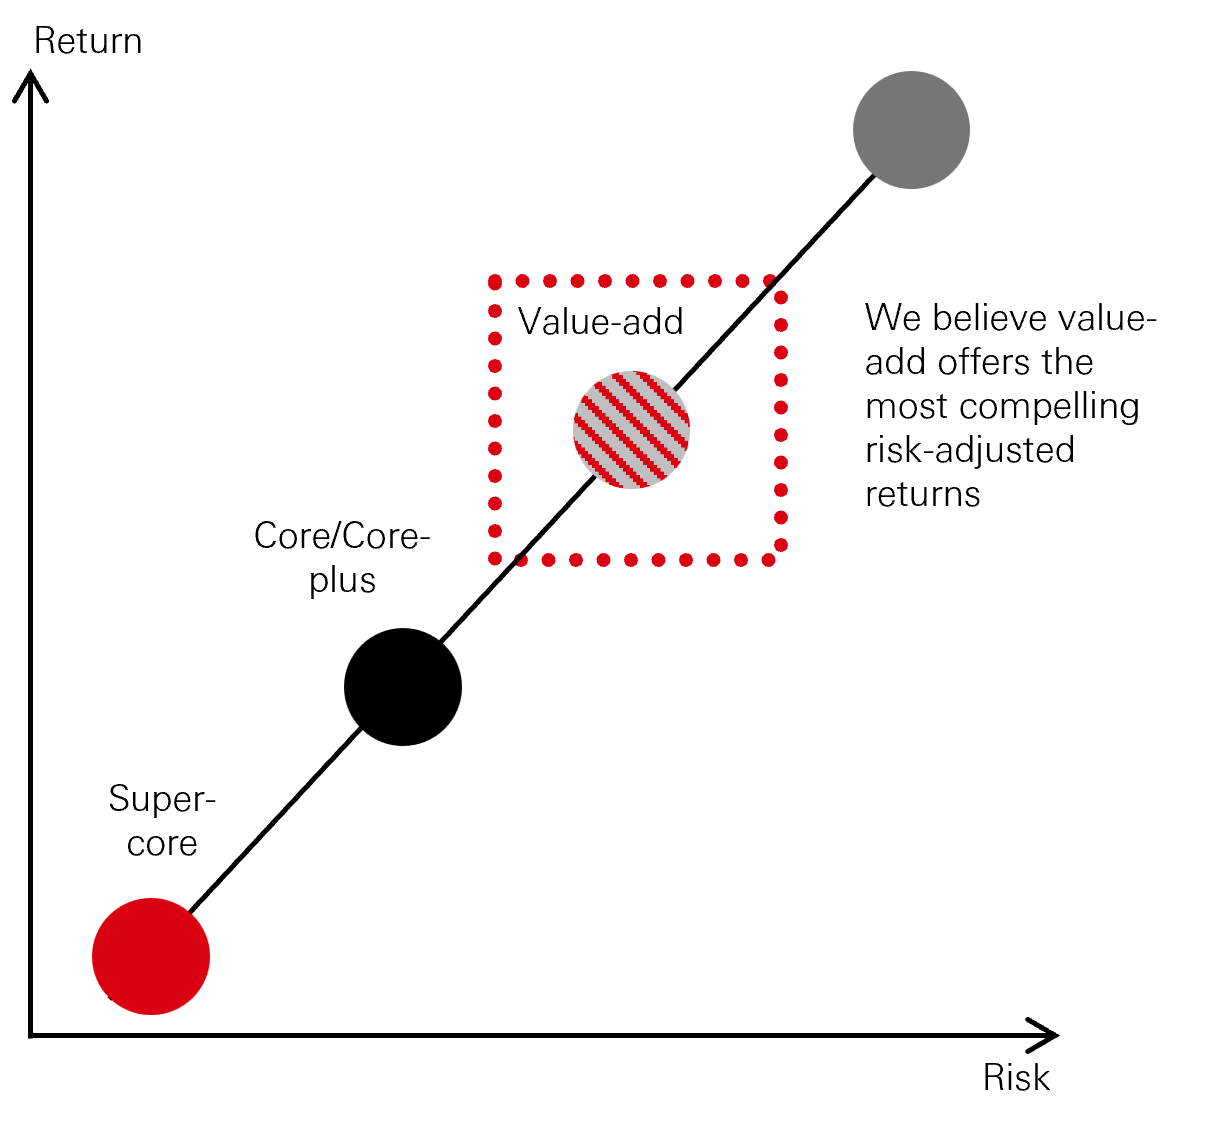
Click the image to enlarge
Source: HSBC Asset Management (2026)
Figure 9: Key characteristics of infrastructure strategies
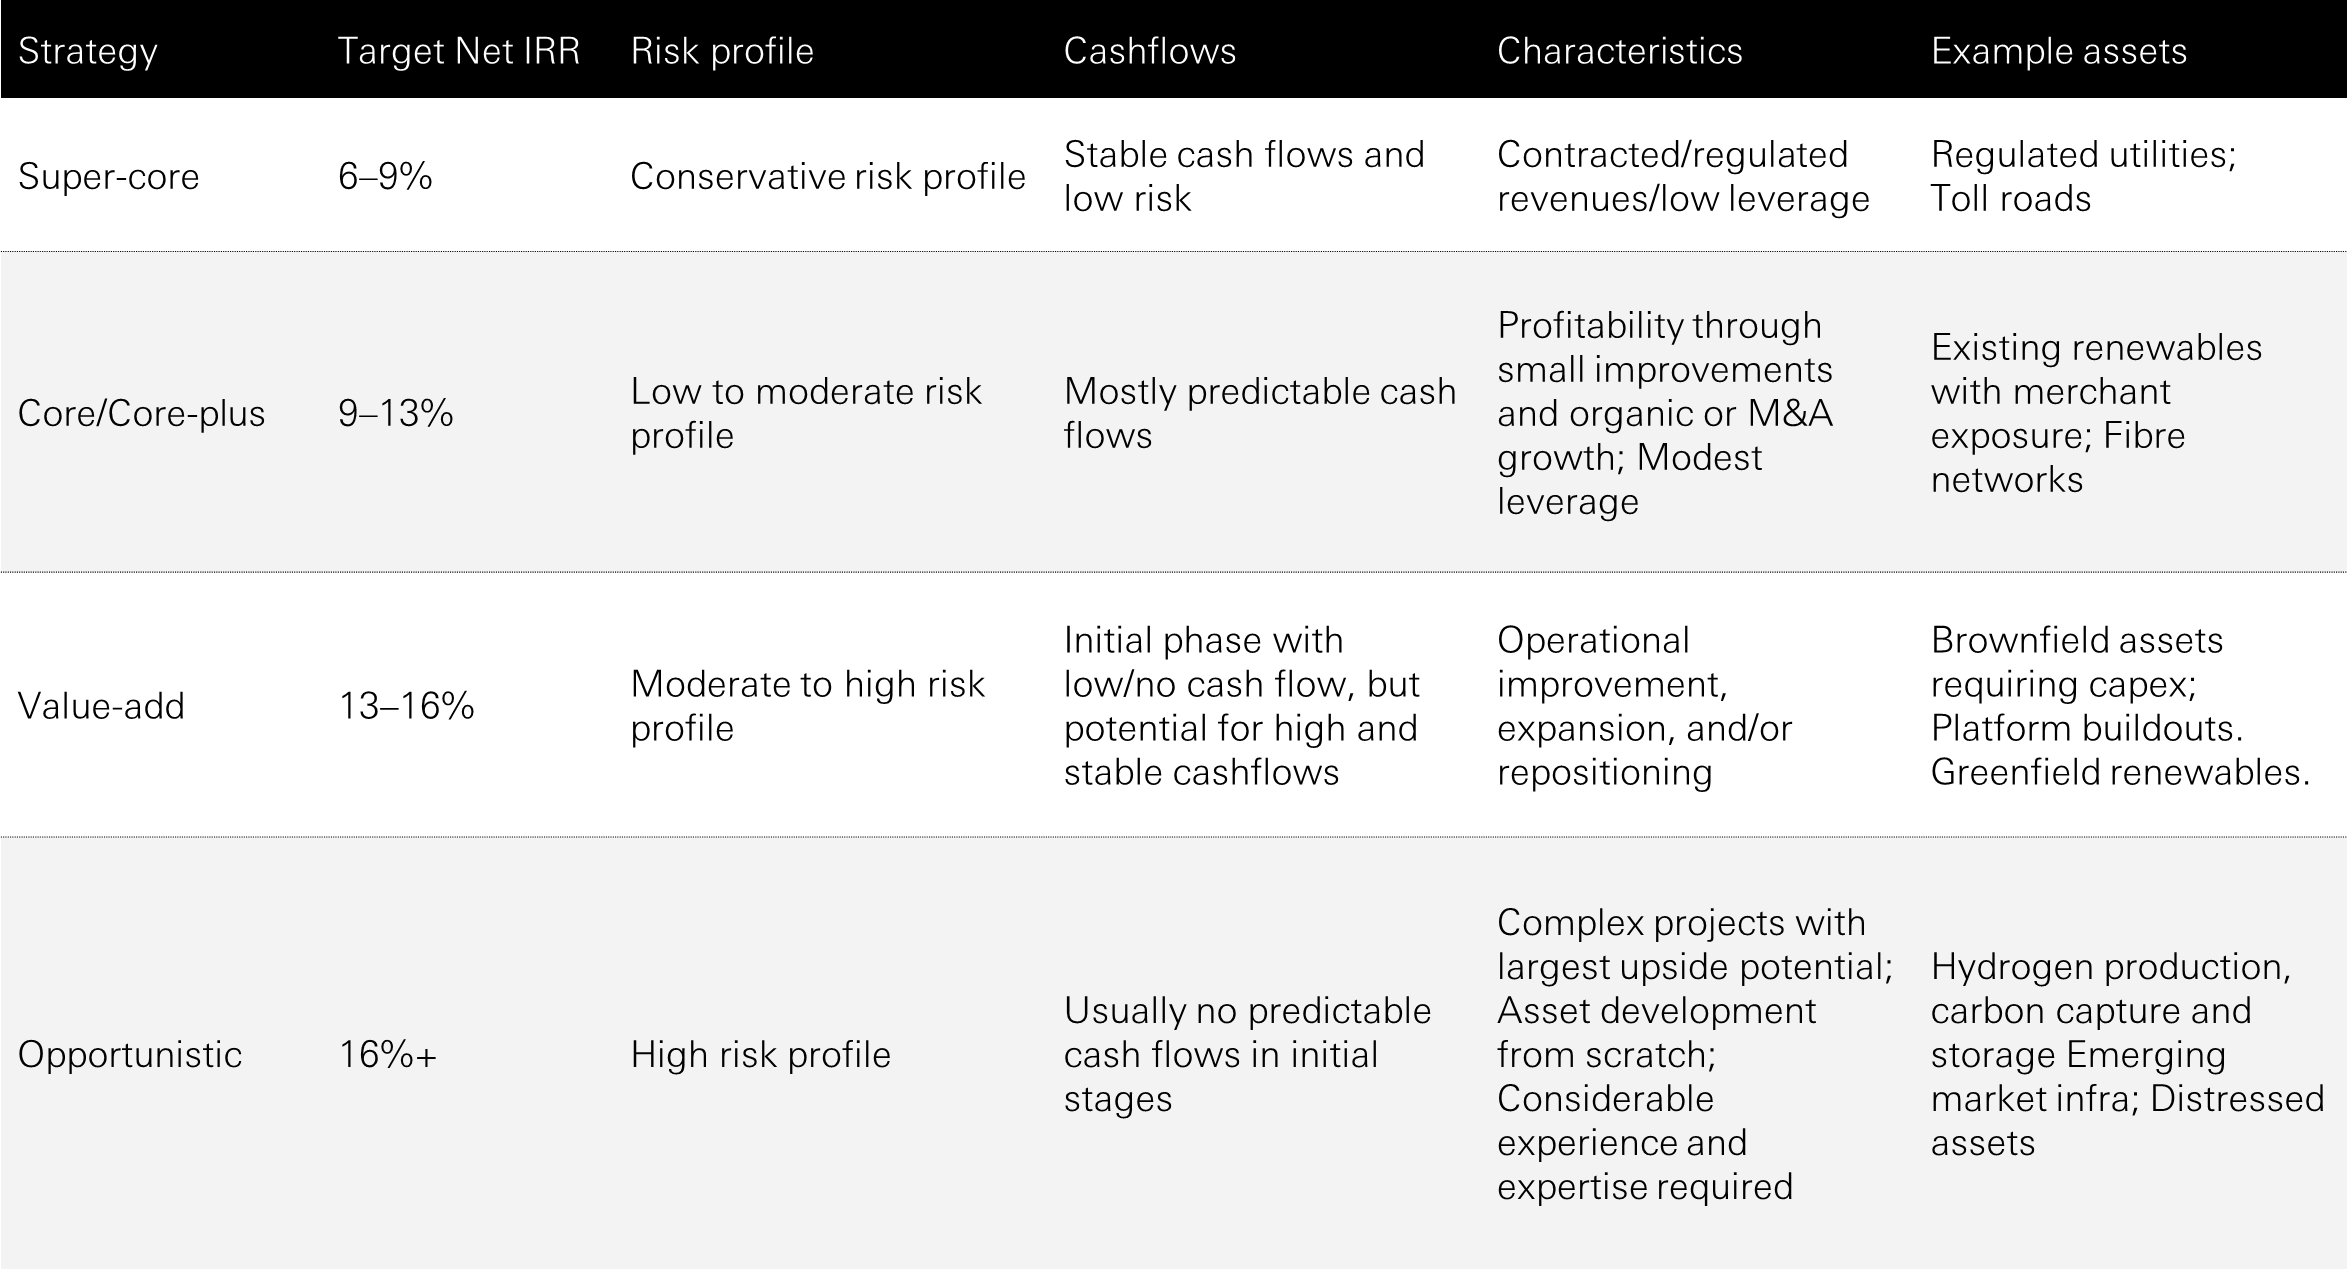
Click the image to enlarge
Source: HSBC Asset Management (2026)
At HSBC Asset Management, we believe value-add infrastructure is the most attractive part of this spectrum. Value-add infrastructure combines downside protection and the essential service characteristics of infrastructure with meaningful return enhancement through operational improvement, capital expenditure expansion, and regulatory positioning.
Value-add also sits at the intersection of structural megatrends, including energy transition, digitalisation, and transport decarbonisation. These assets require active management to unlock value, giving skilled managers a wide opportunity set.
The best value-add managers consistently deliver strong returns, approaching those of private equity, by building high-growth businesses which, once developed, have long-term robust cash flows. These businesses can then be exited to core-plus infrastructure managers, as well as industrial sponsors and other institutional investors.
These benefits may help explain why value-add funds raised a significant amount of capital among infrastructure funds in 2024 and 2025.
Figure 10: Capital raised by strategy focus ( per cent)
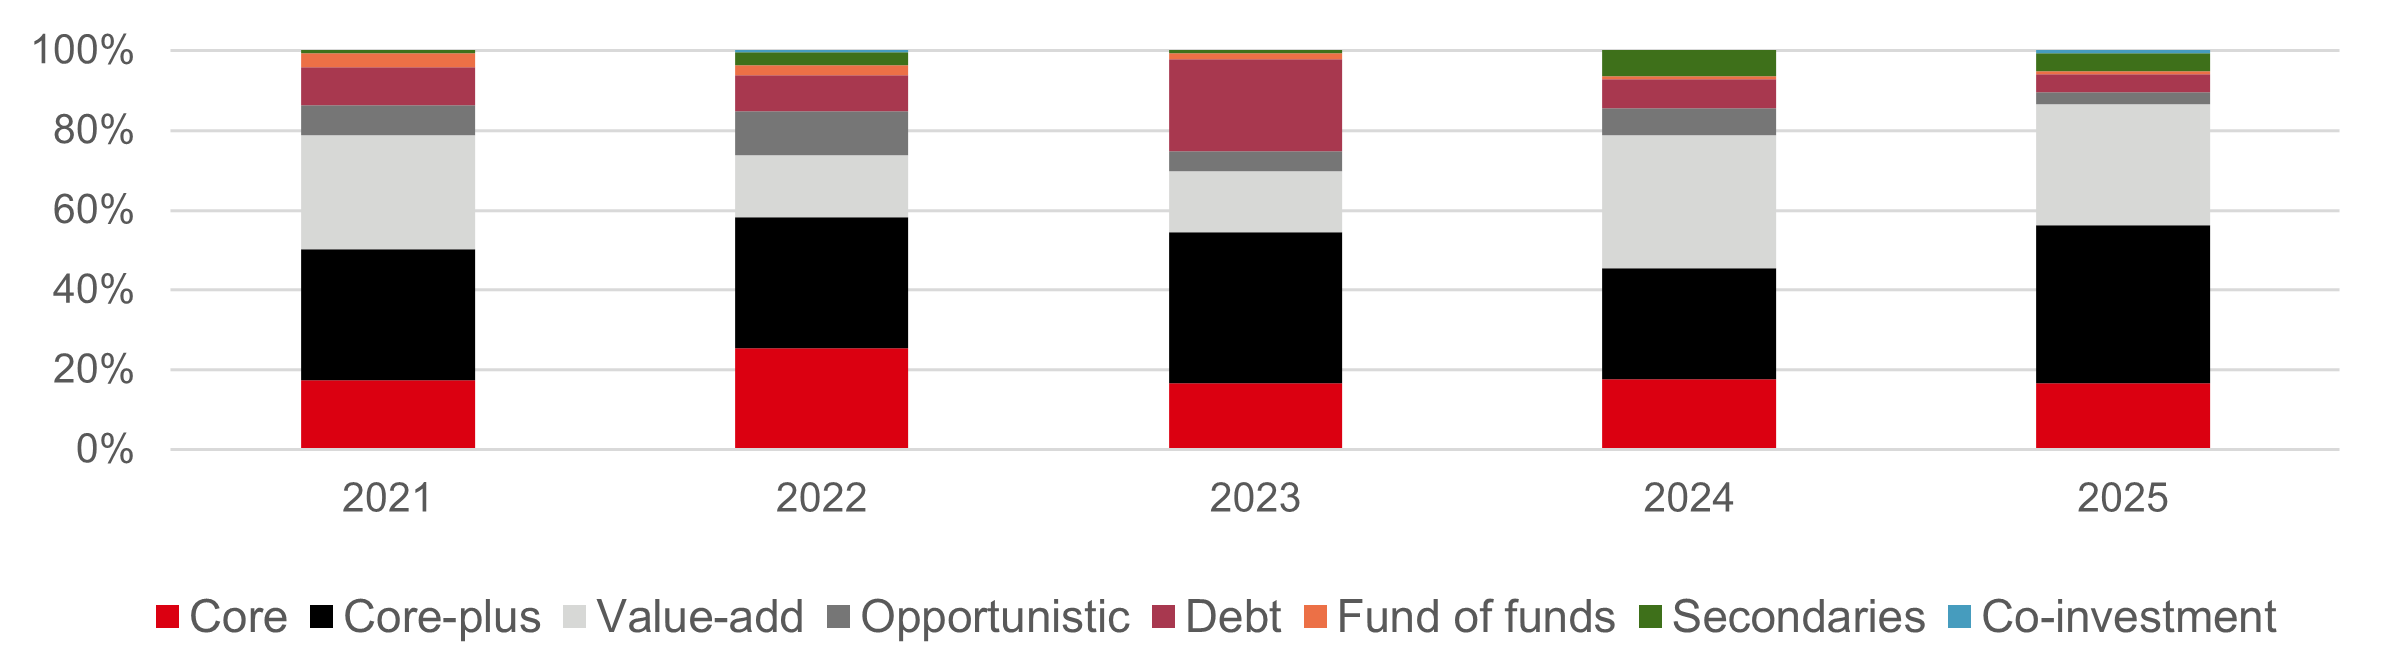
Click the image to enlarge
Source: Infrastructure Investor Perspectives (2025). Value-add infrastructure in 2025 is highlighted.
Appetite for value-add strategies continues to grow going into 2026, with almost a third of investors intending to increase investments. Higher demand can be partly attributed to the prospect of a higher interest rate environment, which makes the long-duration, growth-oriented cash flows associated with value-add infrastructure more attractive on a risk-adjusted basis.
Investors also have existing sizeable exposure to core and core-plus infrastructure and are looking to diversify.
Figure 11: Investors’ strategic infrastructure investment appetite in 2026
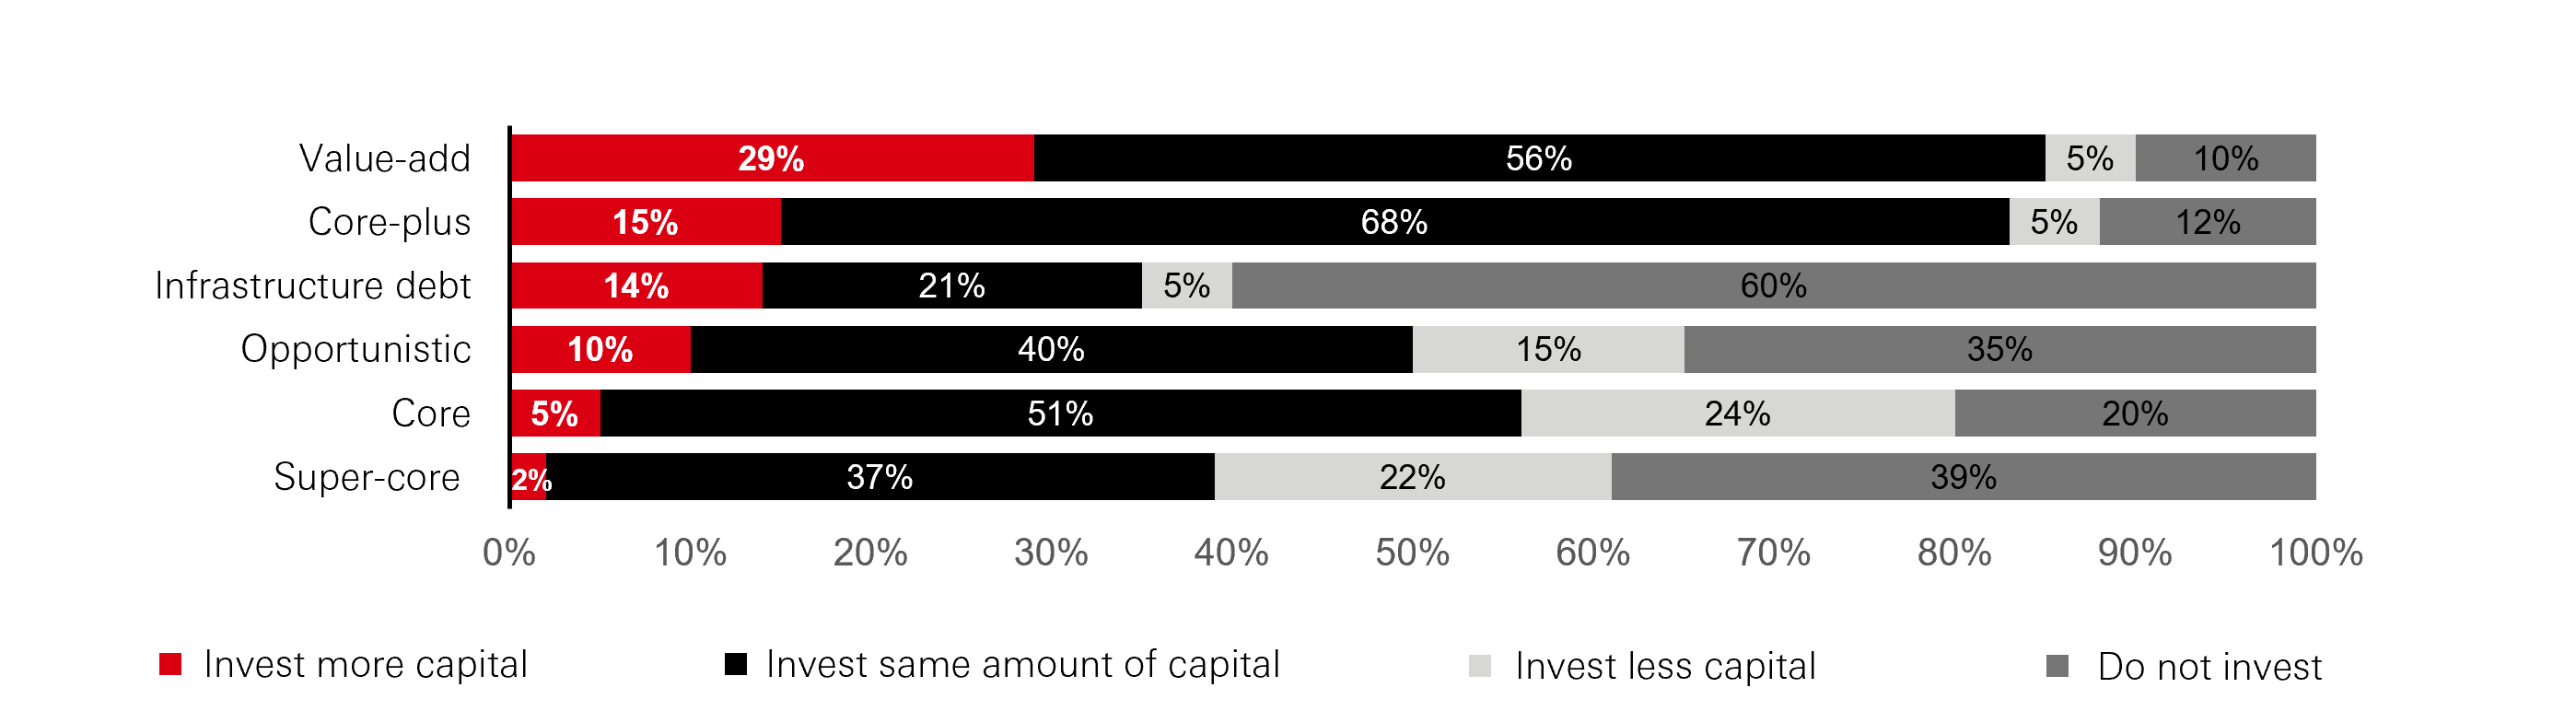
Click the image to enlarge
Source: Infrastructure Investor’s LP Perspectives (2026)
Strengths of a multi-manager approach
While the strategic case for private infrastructure equity is clear, there is a practical implementation challenge for investors in accessing opportunities efficiently.
Private infrastructure markets are complex, fragmented, and characterised by information asymmetry. Deal flow is relationship-driven, valuations require deep sector expertise, and there is significant dispersion in manager performance.
In this environment, a multi-manager approach deployed across primaries, secondaries, and co-investments offers several distinct advantages:
Figure 12: Benefits of a multi-manager approach
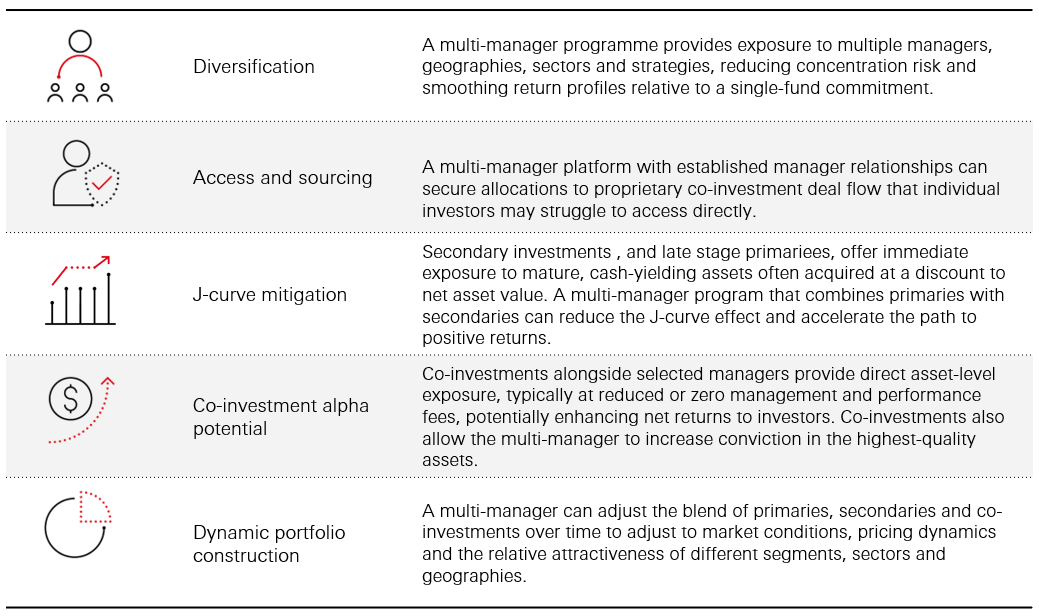
Click the image to enlarge
Source: HSBC Asset Management (2026)
Why manager selection is critical
Amid rising asset prices, lengthening holding periods, and more competitive auction processes, the ability to identify managers with genuine operational value-creation capabilities is paramount.
In private infrastructure (as in all private markets), manager selection is a fundamental determinant of investor outcomes. Performance dispersion between top- and bottom-quartile managers is substantially wider in private markets than in public equities, where returns tend to cluster around index performance12.
In infrastructure, this dispersion is apparent, with the chart below showing top-, median, and bottom-quartile net performance across eleven annual vintages of private infrastructure equity funds (including core, core plus and value add funds).
For the 2018 to 2021 fund vintages, the average reported top-quartile IRR13,14 was 14 per cent and the average bottom-quartile IRR was 7.25 per cent, a difference of nearly half the top-quartile performance.
Figure 13: Infrastructure *returns shown are the average for infrastructure funds in the market
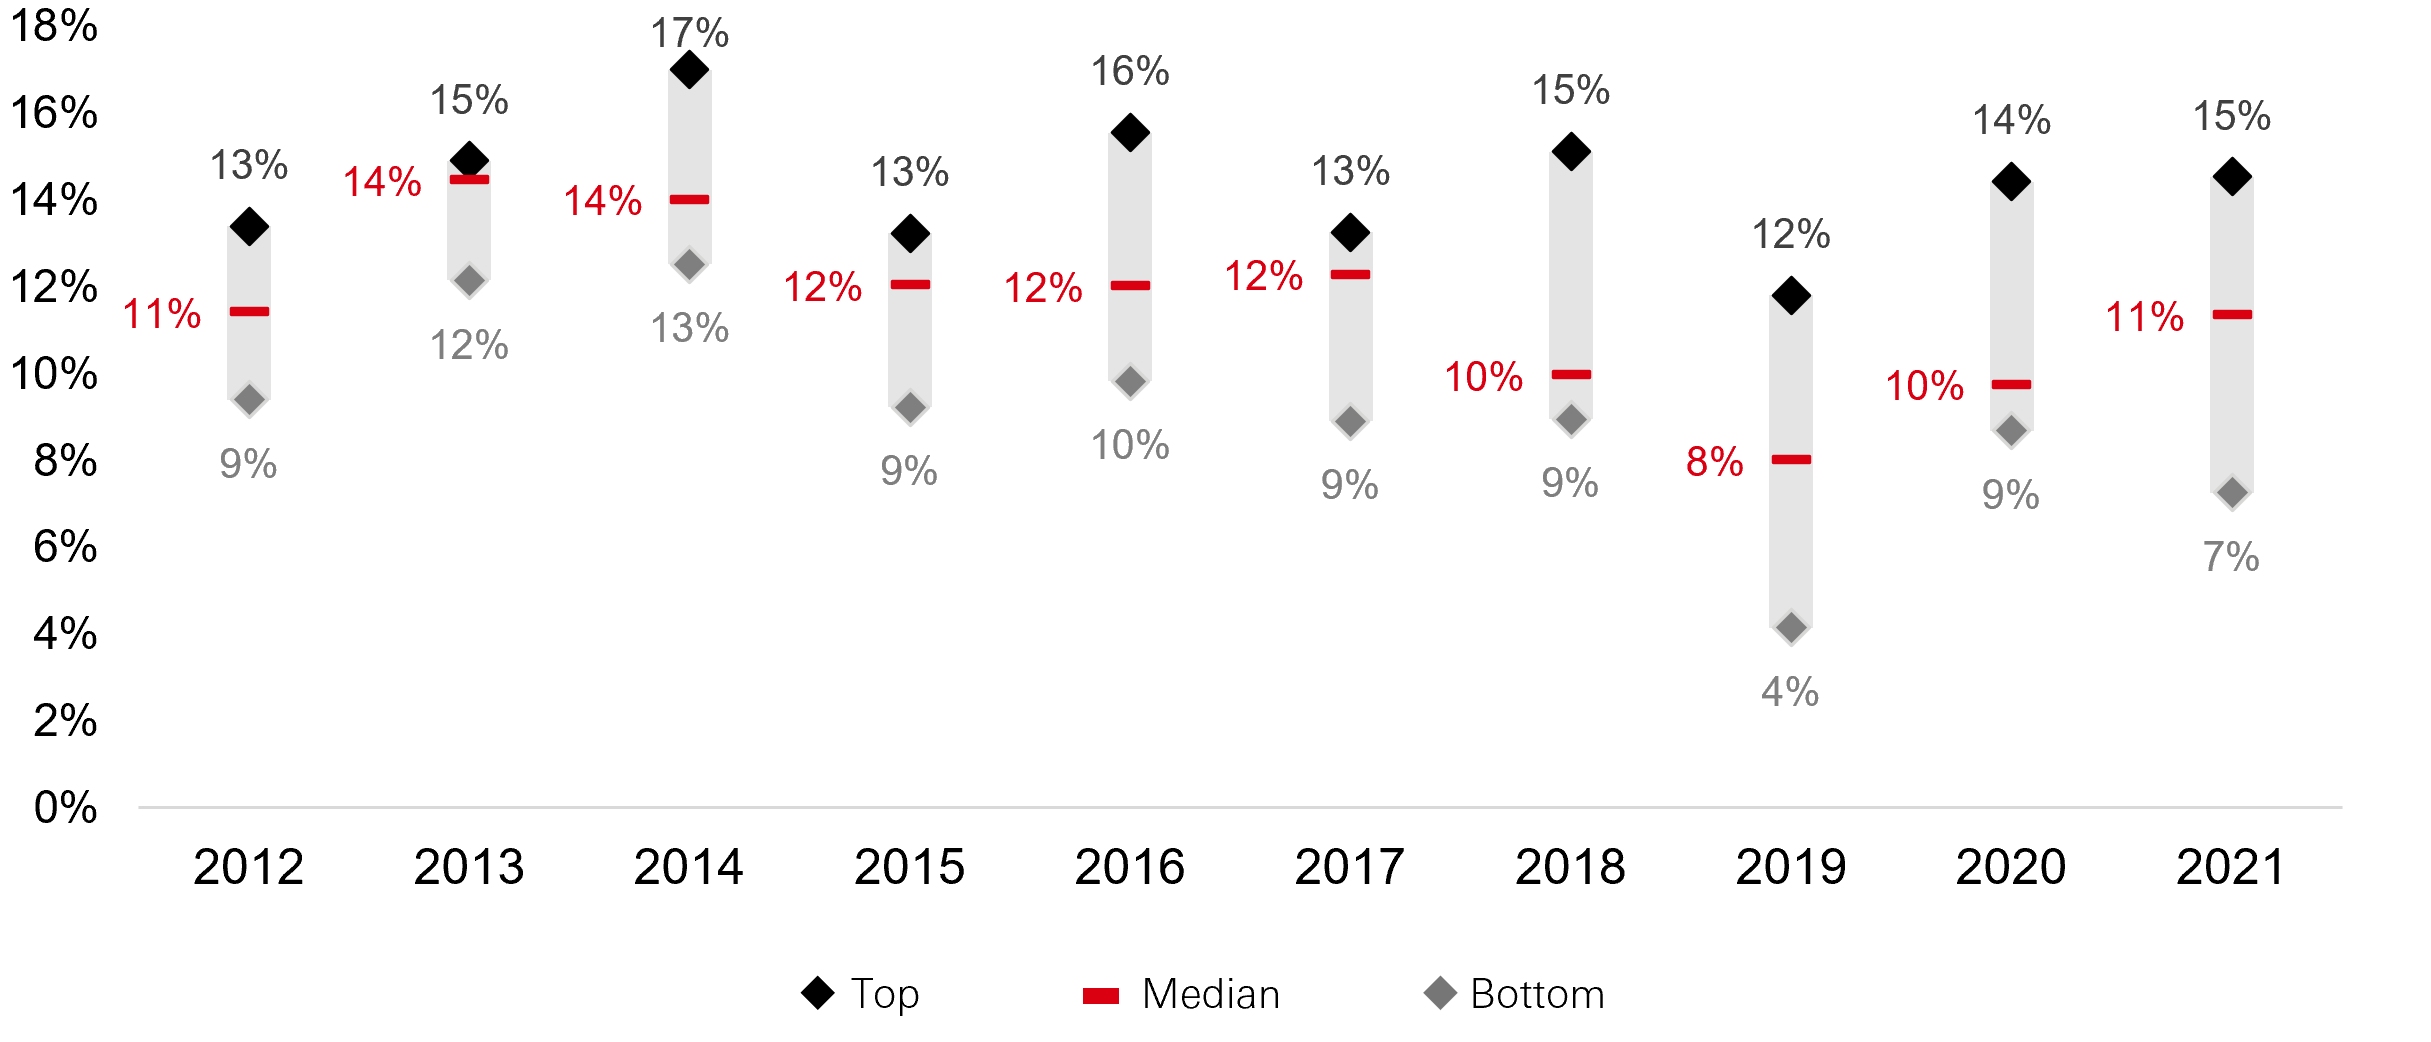
Click the image to enlarge
Source: PitchBook Benchmarking, as of 27 October 2025.
A robust multi-manager approach addresses the challenge of performance dispersion by conducting deep due diligence across a broad universe of managers, evaluating track records net of fees, assessing operational capabilities, alignment of interest, and maintaining ongoing monitoring of the managers.
A skilled multi-manager platform has the potential to access systematically the upper quartile of infrastructure performance, while avoiding the long tail of underperformance, which can significantly impair overall portfolio returns.
Part 3
HSBC AM´s infrastructure proposition
Portfolio construction
Our approach to building value-add infrastructure portfolios is to allocate 60 per cent+ to primaries and up to 40 per cent to select secondaries and co-investments.
We invest in a mixture of multi-sector and thematic funds, where investors can benefit from a range of megatrends including energy transition and digitalisation.
We add geographical diversification and the potential for higher returns through allocation to growth markets.
With this high-conviction investment approach, we have demonstrated the potential ability to reach the high end of the expected return range of 13-16 per cent for value-add infrastructure15.
Case studies
Below are three investments that have been completed by the managers in our Infrastructure portfolio. These examples illustrate investments across the thematics explored earlier.
|
Southeast Asian cold storage platform This is a leading cold chain operator in the Philippines, providing a full suite of cold storage and value-added services across five facilities. There are strong macro tailwinds for cold storage in the region, including rapid urbanisation, economic growth, and a rising middle class. Food and beverage consumption in the Philippines is expected to rise 51 per cent over 2024-2029 . Demand is outpacing cold storage infrastructure supply, contributing to significant food wastage and farmer value loss. The market is highly fragmented, enabling a platform strategy: expand via greenfield developments and consolidate through targeted bolt-on acquisitions to triple existing capacity. The company has grown capacity by four times in five years, established itself as a dominant distribution partner, and benefits from long-term, sticky customer relationships supported by integrated processing, built-to-suit storage, and distribution hub services. |
|
US data centre platform Our selected digital infrastructure manager has invested in a leading US data centre co-location, interconnection and services provider, with 42 facilities across 19 markets and significant capacity (mostly owned or under long leases). The thesis is that accelerating AI adoption, cloud growth, and tight supply are driving strong demand and pricing for ‘edge hyperscale’ deployments that support latency-sensitive cloud and AI inference. The company’s growth plan focuses on expanding in six core markets in the United States. In the 2025 financial year, the company’s EBITDA grew by more than 13 per cent. This is an opportunity to invest at an attractive valuation and deferred investment schedule into a funded business plan for the next several years, and with the benefit of the manager’s co-control governance of the company. We believe the company will benefit from the manager’s deep data centre experience and digital infrastructure expertise as well as continuity of leadership. |
|
European low-carbon power infrastructure An energy manager in which we invested has launched a new infrastructure platform focused on developing ‘powered land’ solutions for large-scale data centre sites across Europe. The platform aims to partner with local utilities to secure access to low-carbon power and design sites that integrate well with local communities. The investment thesis is driven by rapid growth in European data centre demand (forecast to nearly triple power capacity over the next decade), supportive regulation and funding initiatives (including the EU’s AI Continent Action Plan and InvestAI), and opportunities in emerging markets outside traditional hubs due to grid congestion. Europe’s relatively low-carbon grid is positioned as a key advantage for sustainable operations. A similar platform in the US in the energy manager’s previous fund has so far delivered an outstanding multiple of money invested. |
Conclusion: Capturing the infrastructure opportunity
Infrastructure should no longer be perceived as a niche allocation; it is becoming an important asset class for investors – and for good reason. The asset class combines essential service resilience with inflation protection, and the potential for attractive risk-adjusted returns.
Structural megatrends, including the energy transition and digitalisation, are expanding the investable universe and creating a multi-decade demand cycle for new and upgraded infrastructure across developed and emerging markets. Given an estimated global infrastructure investment need of USD106 trillion by 2040,2 the opportunity set is vast and enduring.
We believe value-add infrastructure is the most attractive part of the private infrastructure equity spectrum, combining downside protection and the essential services characteristics of infrastructure with meaningful return enhancement and exposure to these structural megatrends.
Capturing this opportunity requires more than a passive allocation. Infrastructure markets are complex, and manager selection is paramount with notable dispersion between top- and bottom-performing managers.
At HSBC Asset Management, we have a long and successful heritage in infrastructure investing. Our multi-manager infrastructure investment approach is comprised of high conviction, differentiated sourcing capabilities, stringent asset selection, and rigorous due diligence and monitoring. We believe blending primary fund commitments, secondary transactions and select co-investments offers the most efficient route to building a high-quality and diversified infrastructure portfolio.
The views expressed in this document are held at the time of preparation and are subject to change without notice. Any forecast, projection or target where provided is indicative only and is not guaranteed in any way. HSBC Asset Management accepts no liability for any failure to meet such forecast, projection, or target. Diversification does not ensure a profit or protect against loss. Past performance does not predict future returns. For informational purposes only and should not be construed as a recommendation to invest in the specific country, product, strategy, sector, or security. Index returns assume reinvestment of all distributions and do not reflect fees or expenses. You cannot invest directly in an index. Any views expressed are held at the time of preparation and are subject to change without notice. For illustrative purposes only. There is no guarantee that the trend illustrated by the chart above will continue. Any views expressed were held at the time of preparation and are subject to change without notice.
1 ‘Infrastructure Construction Global Market Report 2026’, The Business Research Company (2026)
2 ‘The infrastructure moment’. McKinsey (2025) (leveraging various data sources)
3 ‘Emerging markets: Bridging the USD43 trillion infrastructure gap’, Aberdeen Investments (2025)
4 ‘How large are global infrastructure needs?’, Aberdeen Investments (2025)
5 ‘Infrastructure: Investing to support global growth’, McKinsey (2026)
6 ‘World energy investment 2025’, IEA (2025)
7 ‘Electricity 2026: Analysis and forecast to 2030’, IEA (2026)
8 ‘Energy transition investment trends 2026’, BloombergNEF (2026)
9 ‘Beyond the grid: Expanding the investment universe in global infrastructure’, BNY Mellon (2026)
10 ‘2026 Global Data Center Outlook’, JLL (2026)
11 ‘Opportunities abound in Asia Pacific’s transforming power markets’, Wood Mackenzie (2024) (Data refers to wind and solar).
12‘Asset manager selection guide: Performance dispersion analysis’, NASDAQ eVestment (2025)
13 IRR, or ‘Internal Rate of Return’ indicates the annualised rate of return a project or investment is expected to generate. A higher IRR signals a more attractive investment
14 IRR as of 27 October 2025.
Key risks
The views expressed above were held at the time of preparation and are subject to change without notice. Any forecast, projection or target where provided is indicative only and is not guaranteed in any way. HSBC Asset Management accepts no liability for any failure to meet such forecast, projection or target
- Alternatives risk: There are additional risks associated with specific alternative investments within the portfolios; these investments may be less readily reliable than others and it may therefore be difficult to sell in a timely manner at a reasonable price or to obtain reliable information about their value; there may also be greater potential for significant price movements.
- Equity risk: Portfolios that invest in securities listed on a stock exchange or market could be affected by general changes in the stock market. The value of investments can go down as well as up due to equity markets movements.
- Interest rate risk: As interest rates rise debt securities will fall in value. The value of debt is inversely proportional to interest rate movements.
- Counterparty risk: The possibility that the counterparty to a transaction may be unwilling or unable to meet its obligations.
- Derivatives risk: Derivatives can behave unexpectedly. The pricing and volatility of many derivatives may diverge from strictly reflecting the pricing or volatility of their underlying reference(s), instrument or asset.
- Emerging markets risk: Emerging markets are less established, and often more volatile, than developed markets and involve higher risks, particularly market, liquidity and currency risks.
- Exchange rate risk: Changes in currency exchange rates could reduce or increase investment gains or investment losses, in some cases significantly.
- Investment leverage risk: Investment leverage occurs when the economic exposure is greater than the amount invested, such as when derivatives are used. A Fund that employs leverage may experience greater gains and/or losses due to the amplification effect from a movement in the price of the reference source.
- Liquidity risk: Liquidity risk is the risk that a Fund may encounter difficulties meeting its obligations in respect of financial liabilities that are settled by delivering cash or other financial assets, thereby compromising existing or remaining investors.
- Operational risk: Operational risks may subject the Fund to errors affecting transactions, valuation, accounting, and financial reporting, among other things.
- Style risk: Different investment styles typically go in and out of favour depending on market conditions and investor sentiment.
- Model risk: Model risk occurs when a financial model used in the portfolio management or valuation processes does not perform the tasks or capture the risks it was designed to. It is considered a subset of operational risk, as model risk mostly affects the portfolio that uses the model.
Important information
For Professional Clients and intermediaries within countries and territories set out below; and for Institutional Investors and Financial Advisors in the US. This document should not be distributed to or relied upon by Retail clients/investors.
The value of investments and the income from them can go down as well as up and investors may not get back the amount originally invested. The performance figures contained in this document relate to past performance, which should not be seen as an indication of future returns. Future returns will depend, inter alia, on market conditions, investment manager’s skill, risk level and fees. Where overseas investments are held the rate of currency exchange may cause the value of such investments to go down as well as up. Investments in emerging markets are by their nature higher risk and potentially more volatile than those inherent in some established markets. Economies in emerging markets generally are heavily dependent upon international trade and, accordingly, have been and may continue to be affected adversely by trade barriers, exchange controls, managed adjustments in relative currency values and other protectionist measures imposed or negotiated by the countries and territories with which they trade. These economies also have been and may continue to be affected adversely by economic conditions in the countries and territories in which they trade.
The contents of this document may not be reproduced or further distributed to any person or entity, whether in whole or in part, for any purpose. All non-authorised reproduction or use of this document will be the responsibility of the user and may lead to legal proceedings. The material contained in this document is for general information purposes only and does not constitute advice or a recommendation to buy or sell investments. Some of the statements contained in this document may be considered forward looking statements which provide current expectations or forecasts of future events. Such forward looking statements are not guarantees of future performance or events and involve risks and uncertainties. Actual results may differ materially from those described in such forward-looking statements as a result of various factors. We do not undertake any obligation to update the forward-looking statements contained herein, or to update the reasons why actual results could differ from those projected in the forward-looking statements. This document has no contractual value and is not by any means intended as a solicitation, nor a recommendation for the purchase or sale of any financial instrument in any jurisdiction in which such an offer is not lawful. The views and opinions expressed herein are those of HSBC Asset Management at the time of preparation and are subject to change at any time. These views may not necessarily indicate current portfolios' composition. Individual portfolios managed by HSBC Asset Management primarily reflect individual clients' objectives, risk preferences, time horizon, and market liquidity. Foreign and emerging markets: investments in foreign markets involve risks such as currency rate fluctuations, potential differences in accounting and taxation policies, as well as possible political, economic, and market risks. These risks are heightened for investments in emerging markets which are also subject to greater illiquidity and volatility than developed foreign markets. This commentary is for information purposes only. It is a marketing communication and does not constitute investment advice or a recommendation to any reader of this content to buy or sell investments nor should it be regarded as investment research. It has not been prepared in accordance with legal requirements designed to promote the independence of investment research and is not subject to any prohibition on dealing ahead of its dissemination. This document is not contractually binding nor are we required to provide this to you by any legislative provision.
All data from HSBC Asset Management unless otherwise specified. Any third-party information has been obtained from sources we believe to be reliable, but which we have not independently verified. HSBC Asset Management is the brand name for the asset management business of HSBC Group, which includes the investment activities that may be provided through our local regulated entities. HSBC Asset Management is a group of companies in many countries and territories throughout the world that are engaged in investment advisory and fund management activities, which are ultimately owned by HSBC Holdings Plc. (HSBC Group).
- In Australia, this document is issued by HSBC Bank Australia Limited ABN 48 006 434 162, AFSL 232595, for HSBC Global Asset Management (Hong Kong) Limited ARBN 132 834 149 and HSBC Global Asset Management (UK) Limited ARBN 633 929 718. This document is for institutional investors only and is not available for distribution to retail clients (as defined under the Corporations Act). HSBC Global Asset Management (Hong Kong) Limited and HSBC Global Asset Management (UK) Limited are exempt from the requirement to hold an Australian financial services license under the Corporations Act in respect of the financial services they provide. HSBC Global Asset Management (Hong Kong) Limited is regulated by the Securities and Futures Commission of Hong Kong under the Hong Kong laws, which differ from Australian laws. HSBC Global Asset Management (UK) Limited is regulated by the Financial Conduct Authority of the United Kingdom and, for the avoidance of doubt, includes the Financial Services Authority of the United Kingdom as it was previously known before 1 April 2013, under the laws of the United Kingdom, which differ from Australian laws;
- In Bermuda, this document is issued by HSBC Global Asset Management (Bermuda) Limited, of 37 Front Street, Hamilton, Bermuda which is licensed to conduct investment business by the Bermuda Monetary Authority;
- In France, Belgium, Netherlands, Luxembourg, Portugal, Greece, Finland, Norway, Denmark, Spain and Sweden this document is issued by HSBC Global Asset Management (France), a Portfolio Management Company authorised by the French regulatory authority AMF (no. GP99026);
- In Germany, this document is issued by HSBC Global Asset Management (Deutschland) GmbH which is regulated by BaFin (German clients) respective by the Austrian Financial Market Supervision FMA (Austrian clients);
- In Hong Kong, this document is issued by HSBC Global Asset Management (Hong Kong) Limited, which is regulated by the Securities and Futures Commission. This content has not been reviewed by the Securities and Futures Commission;
- In India, this document is issued by HSBC Asset Management (India) Pvt Ltd. which is regulated by the Securities and Exchange Board of India;
- In Italy, this document is issued by HSBC Global Asset Management (France), a Portfolio Management Company authorised by the French regulatory authority AMF (no. GP99026), through its Italian branch, regulated by Banca d’Italia and Commissione Nazionale per le Società e la Borsa (Consob);
- In Japan, this document is issued by HSBC Asset Management (Japan) Ltd (JRN 3010001124868), regulated by the Financial Services Agency;
- In Malta, this document is issued by HSBC Global Asset Management (Malta) Limited which is regulated and licensed to conduct Investment Services by the Malta Financial Services Authority under the Investment Services Act;
- In Mexico, this document is issued by HSBC Global Asset Management (Mexico), SA de CV, Sociedad Operadora de Fondos de Inversión, Grupo Financiero HSBC which is regulated by Comisión Nacional Bancaria y de Valores;
- In the United Arab Emirates, this document is issued by HSBC Investment Funds (Luxembourg) S.A. – Dubai Branch (Level 20, HSBC Tower, PO Box 66, Downtown Dubai, United Arab Emirates) regulated by the Capital Market Authority (CMA) in the UAE to conduct investment fund management, portfolios management, fund administration activities (CMA Category 2 license No.20200000336) and promotion activities (CMA Category 5 license No.20200000327).
- In the United Arab Emirates, this document is issued by HSBC Global Asset Management MENA, a unit within HSBC Bank Middle East Limited, U.A.E Branch, PO Box 66 Dubai, UAE, regulated by the Central Bank of the U.A.E. and the Capital Market Authority in the UAE under CMA license number 602004 for the purpose of this promotion and lead regulated by the Dubai Financial Services Authority. HSBC Bank Middle East Limited is a member of the HSBC Group and HSBC Global Asset Management MENA are marketing the relevant product only in a sub-distributing capacity on a principal-to-principal basis. HSBC Global Asset Management MENA may not be licensed under the laws of the recipient’s country of residence and therefore may not be subject to supervision of the local regulator in the recipient’s country of residence. One of more of the products and services of the manufacturer may not have been approved by or registered with the local regulator and the assets may be booked outside of the recipient’s country of residence.
- In Singapore, this document is issued by HSBC Global Asset Management (Singapore) Limited, which is regulated by the Monetary Authority of Singapore. The content in the document/video has not been reviewed by the Monetary Authority of Singapore;
- In Switzerland, this document is issued by HSBC Global Asset Management (Switzerland) AG. This document is intended for professional investor use only. For opting in and opting out according to FinSA, please refer to our website; if you wish to change your client categorization, please inform us. HSBC Global Asset Management (Switzerland) AG having its registered office at Gartenstrasse 26, PO Box, CH-8002 Zurich has a licence as an asset manager of collective investment schemes and as a representative of foreign collective investment schemes. Disputes regarding legal claims between the Client and HSBC Global Asset Management (Switzerland) AG can be settled by an ombudsman in mediation proceedings. HSBC Global Asset Management (Switzerland) AG is affiliated to the ombudsman FINOS having its registered address at Talstrasse 20, 8001 Zurich. There are general risks associated with financial instruments, please refer to the Swiss Banking Association (“SBA”) Brochure “Risks Involved in Trading in Financial Instruments”;
- In Taiwan, this document is issued by HSBC Global Asset Management (Taiwan) Limited which is regulated by the Financial Supervisory Commission R.O.C. (Taiwan);
- In Turkiye, this document is issued by HSBC Asset Management A.S. Turkiye (AMTU) which is regulated by Capital Markets Board of Turkiye. Any information here is not intended to distribute in any jurisdiction where AMTU does not have a right to. Any views here should not be perceived as investment advice, product/service offer and/or promise of income. Information given here might not be suitable for all investors and investors should be giving their own independent decisions. The investment information, comments and advice given herein are not part of investment advice activity. Investment advice services are provided by authorized institutions to persons and entities privately by considering their risk and return preferences, whereas the comments and advice included herein are of a general nature. Therefore, they may not fit your financial situation and risk and return preferences. For this reason, making an investment decision only by relying on the information given herein may not give rise to results that fit your expectations.
- In the UK, this document is issued by HSBC Global Asset Management (UK) Limited, which is authorised and regulated by the Financial Conduct Authority;
- In the US, this document is issued by HSBC Securities (USA) Inc., an HSBC broker dealer registered in the US with the Securities and Exchange Commission under the Securities Exchange Act of 1934. HSBC Securities (USA) Inc. is also a member of NYSE/FINRA/SIPC. HSBC Securities (USA) Inc. is not authorized by or registered with any other non-US regulatory authority. The contents of this document are confidential and may not be reproduced or further distributed to any person or entity, whether in whole or in part, for any purpose without prior written permission.
- In Chile, operations by HSBC's headquarters or other offices of this bank located abroad are not subject to Chilean inspections or regulations and are not covered by warranty of the Chilean state. Obtain information about the state guarantee to deposits at your bank or on www.cmfchile.cl;
- In Colombia, HSBC Bank USA NA has an authorized representative by the Superintendencia Financiera de Colombia (SFC) whereby its activities conform to the General Legal Financial System. SFC has not reviewed the information provided to the investor. This document is for the exclusive use of institutional investors in Colombia and is not for public distribution;
- In Costa Rica, the Fund and any other products or services referenced in this document are not registered with the Superintendencia General de Valores (“SUGEVAL”) and no regulator or government authority has reviewed this document, or the merits of the products and services referenced herein. This document is directed at and intended for institutional investors only.
- In Peru, HSBC Bank USA NA has an authorized representative by the Superintendencia de Banca y Seguros in Perú whereby its activities conform to the General Legal Financial System - Law No. 26702. Funds have not been registered before the Superintendencia del Mercado de Valores (SMV) and are being placed by means of a private offer. SMV has not reviewed the information provided to the investor. This document is for the exclusive use of institutional investors in Perú and is not for public distribution;
- In Uruguay, operations by HSBC's headquarters or other offices of this bank located abroad are not subject to Uruguayan inspections or regulations and are not covered by warranty of the Uruguayan state. Further information may be obtained about the state guarantee to deposits at your bank or on www.bcu.gub.uy.
Copyright © HSBC Global Asset Management Limited 2026. All rights reserved. No part of this publication may be reproduced, stored in a retrieval system, or transmitted, on any form or by any means, electronic, mechanical, photocopying, recording, or otherwise, without the prior written permission of HSBC Asset Management.
Content ID: D072268; Expiry Date: 30.11.2026