
Multi-Asset Insights
In a nutshell
- The closure of the Strait of Hormuz and higher oil prices have hit Asian economies unevenly, with sensitivity varying across countries and asset classes depending on energy exposure and policy capacity.
- Oil shocks mainly matter through their impact on inflation and growth expectations, which adjust with lags and differ across Asia, creating dispersion in both macro outcomes and market performance.
- Correlations between Asian assets and oil have become more negative while correlations within Asian asset classes have risen, making intraregional diversification harder and increasing the value of exposures that behave differently in oil driven risk off regimes.
- At the same time, structural themes in AI, semiconductors and energy transition are reshaping Asia’s medium-term landscape, amplifying the gap between more resilient, higher income markets and more vulnerable importers with weaker balance sheets.
Energy shocks and Asian markets
The critical question for Asian investors is not where oil trades today, but how sustained price moves filter into inflation and growth expectations, alter policy paths and force a rethink of what truly diversifies regional risk.
The Middle East conflict has had far reaching ramifications for the global economy, and Asia is very much at the centre of it. The Strait of Hormuz is a vital passage for many Asian countries to access imports of oil and other key commodities. The sensitivity of these economies to the strait’s closure varies significantly, as does that of different asset classes in the region.
While inventories cushioned the initial shock, drawdowns have been rapid, increasing the risk that a prolonged disruption tightens physical supply conditions. For Asia, this amplifies the terms of trade hit for net importers and reinforces the divergence between economies able to secure alternative supplies and those more exposed to shipping chokepoints.
Oil and commodity price shocks
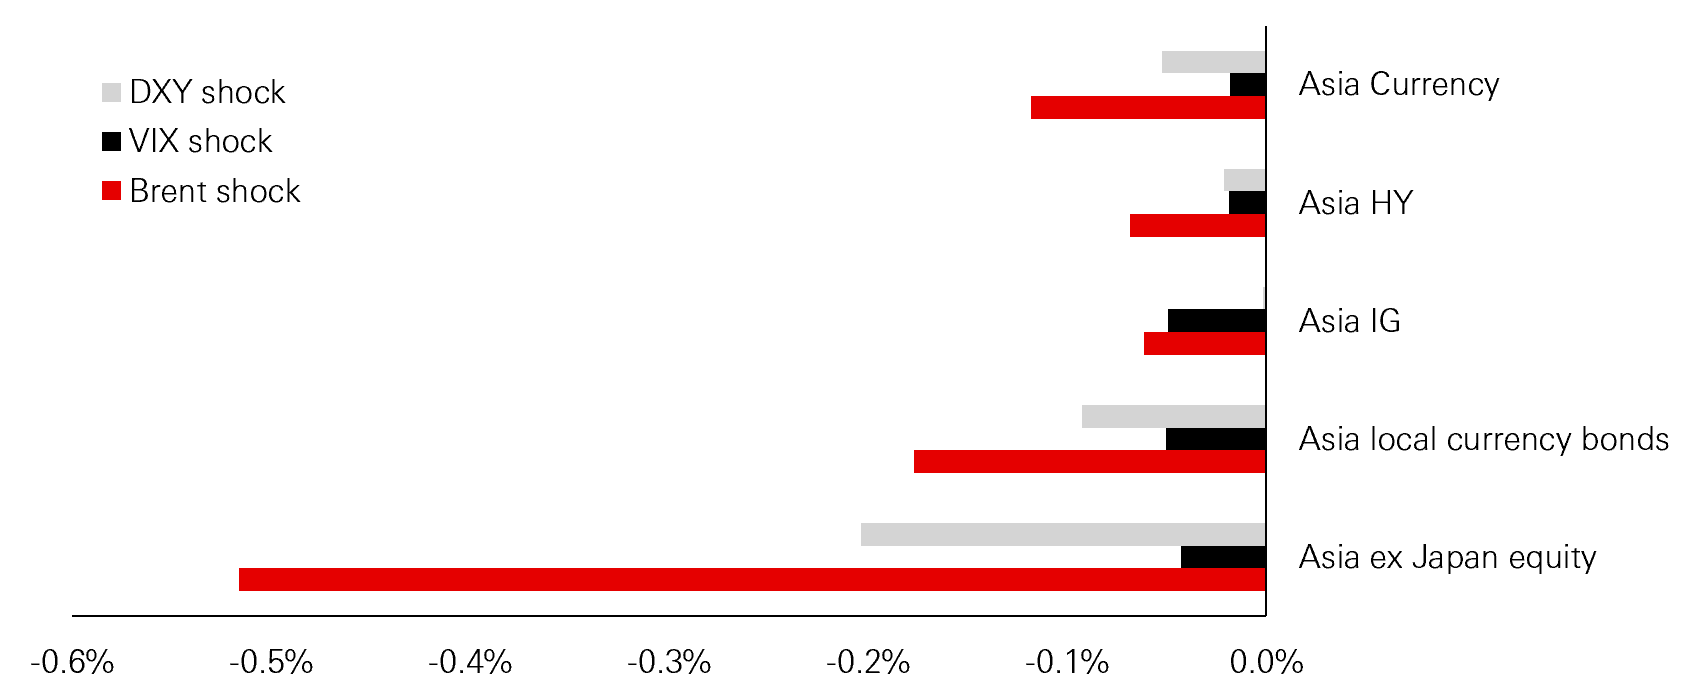
The surge in oil prices following the start of the conflict initially hit the markets and economies of major oil-importing Asian countries. Examining the daily returns for major Asian equity, credit, FX and local‑currency bond indices during past few months can help to uncover where the largest vulnerabilities could lie in these markets. Our results show a one standard deviation oil shock is associated with around a 0.5 per cent decline in the Asia ex‑Japan equity index on the following day. Asian investment grade credit appears more resilient, reflecting its lower beta nature, while local currency bonds and currencies sit between credit and equities in terms of sensitivity.
Figure 1: Impact of oil, dollar and volatility shocks to Asian assets
Click the image to enlarge
Source: HSBC AM, Bloomberg, April 2026.
At the country level, Korea and Taiwan stood out as the most sensitive equity markets across shocks to oil, volatility and the dollar, whereas China, Malaysia and Singapore were notably more resilient. In rates and FX, Korea, Thailand and Australia appeared the most negatively affected, reflecting pro‑cyclical profiles, dollar correlations and the weight of energy in inflation baskets.
Domestic policy capacity was also a key differentiator in how the same oil move is transmitted to markets and the real economy. Where governments can credibly smooth the shock (for example through targeted subsidies, tax adjustments or strategic reserve releases) and central banks have room to stay patient, the episode is more likely to be treated as a temporary terms‑of‑trade hit. Where fiscal space is tighter or inflation is already uncomfortable, the risk is a faster pass‑through into broader prices and a more defensive policy response – raising the probability of weaker growth alongside tighter financial conditions.
The importance of market expectations
The 2022 oil shock showed that the key driver of asset prices is the effect of oil price moves on inflation and growth expectations. Forward 12‑month inflation forecasts only began to rise meaningfully about three months after oil prices started climbing in late 2021 and continued to increase for three to five months after oil peaked in June 2022, highlighting that inflation expectations can be both sensitive to oil and sticky on the way down.
Growth expectations adjusted more slowly. GDP forecasts were still being revised up as oil rose, then began to be marked down three to four months later, continuing to fall for about two further quarters after the oil peak.
The 2022 episode also highlighted how uneven these adjustments can be across Asia. India and Thailand saw some of the largest upward revisions to inflation forecasts, reflecting high energy weights in consumer baskets, while the Philippines experienced one of the longest periods of elevated inflation expectations. On the growth side, India, Malaysia and the Philippines endured some of the deepest downgrades to GDP forecasts, whereas China’s projections proved more resilient and Hong Kong’s recovered relatively quickly, underscoring the role of domestic buffers and policy space in absorbing external shocks.
In the current episode, nominal oil prices are comparable to 2022 and past high oil regimes, but real oil prices are significantly lower, and the global economy is less oil intensive. This suggests that the magnitude and duration of the inflation and growth impact may be more contained than in previous shocks – even if the burden is unevenly distributed across Asia.
Higher income, energy resilient markets such as Australia, Singapore and China tend to hold up better when oil prices are elevated, while Korea, Taiwan, Thailand and Indonesia have proved more sensitive to swings in oil, volatility and the US dollar. For Korea and Taiwan, the main issue is their markets’ high sensitivity to global risk shocks rather than a heavy domestic energy burden, whereas lower income oil importers like Thailand, India and the Philippines are more directly squeezed via high energy shares in consumer spending.
Underlying fiscal and external positions add a second layer to this picture. Developed Asian economies such as Hong Kong, Singapore, Australia and Japan generally have smaller fiscal deficits, stronger current account positions, solid reserve buffers and higher credit ratings, leaving them better placed to absorb prolonged shocks. Korea and Taiwan also look robust on these measures, helped by export driven surpluses and relatively low public debt burdens. By contrast, much of ASEAN (excluding Singapore) and India enter this period with weaker public finances and external accounts, making them more vulnerable to portfolio outflows and currency pressure when risk sentiment deteriorates. China’s headline numbers place it only mid pack, but its strong tax collection capacity, large stock of public assets, predominantly local currency debt and sizeable oil reserves suggest a more resilient underlying position than simple deficit and debt ratios imply.
The oil shock’s effect on correlations
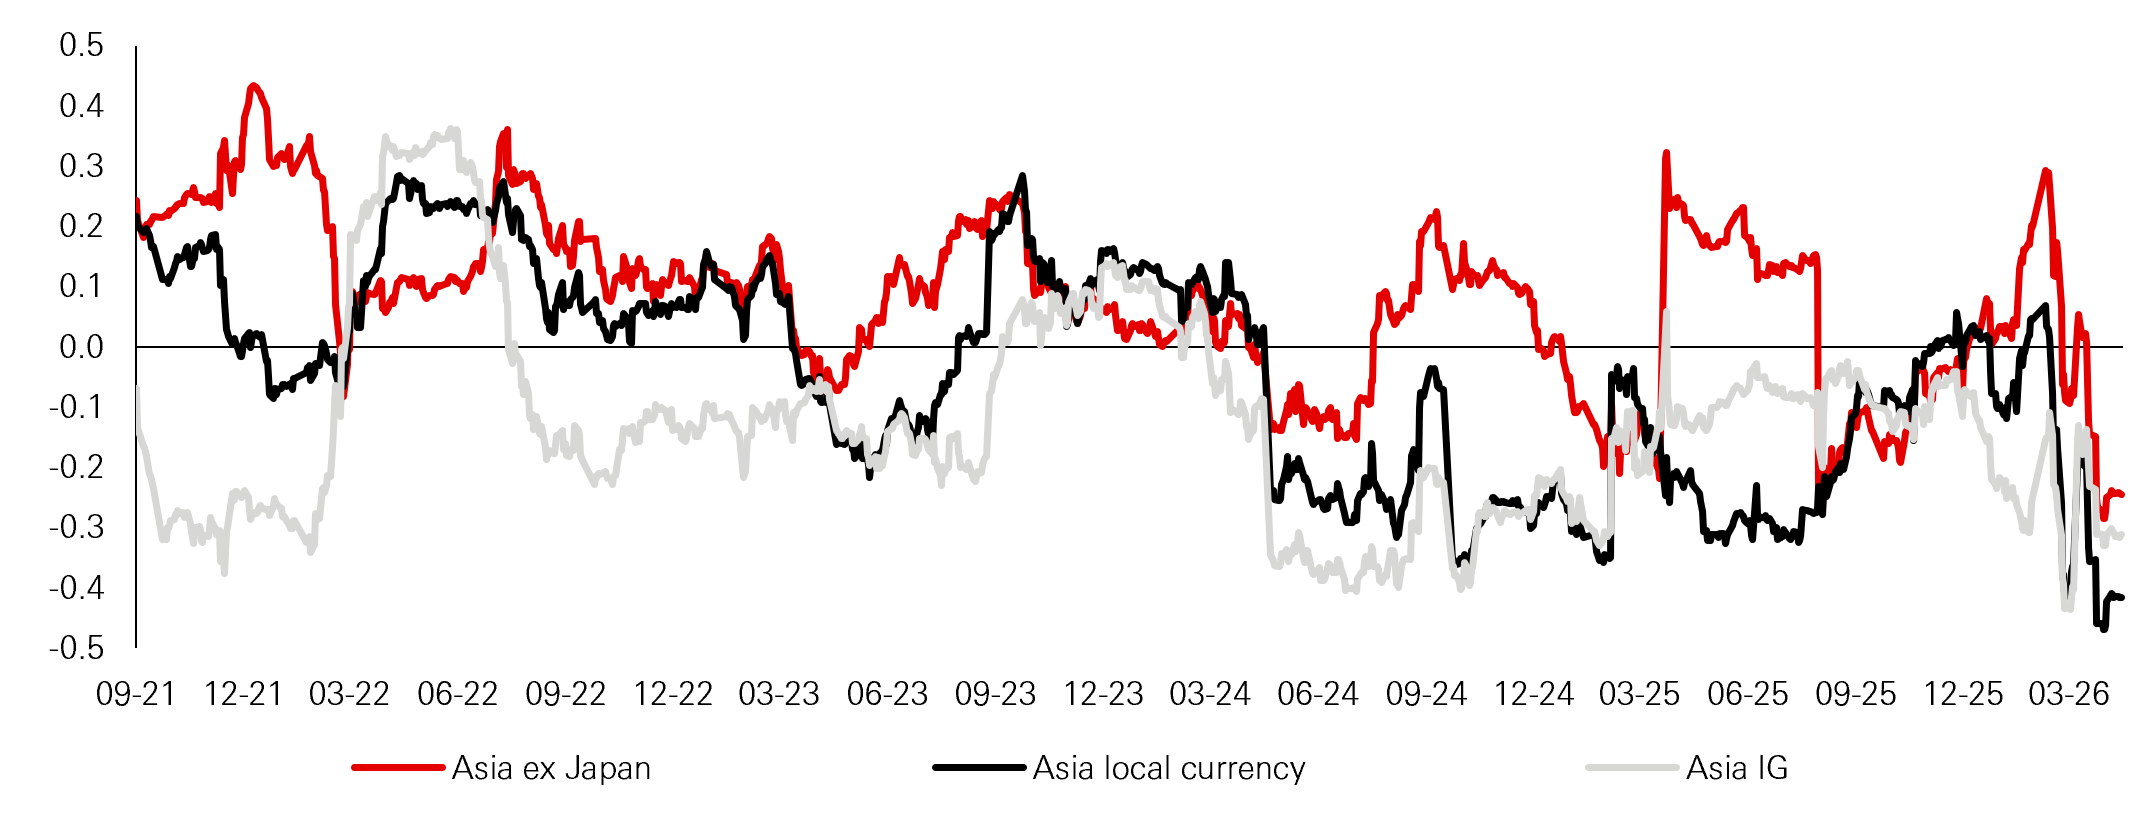
Correlation patterns present an additional challenge for multi-asset investors. Since the conflict escalated, correlations between Asian growth assets and oil have become more negative, particularly for fixed income. At the same time, correlations among Asian asset classes themselves have risen, with many pairwise coefficients above 0.5, limiting intra‑regional diversification just when it is most needed.
Practically, this means portfolio construction gets harder at exactly the wrong time: when correlations within the region rise, switching between Asian equities, credit and local rates may not reduce drawdowns as much as expected. It also raises the bar for diversification, increasing the value of exposures that can behave differently in an oil-driven risk-off regime.
Figure 2: Rolling 90-day correlation with Brent oil prices
Click the image to enlarge
Source: HSBC AM, Bloomberg, April 2026
Policy implications
Policy responses have so far been cautious. Most Asian central banks initially signalled a desire to look through what they hoped would be a temporary oil shock, yet some countries – such as the Philippines and Australia – were quick to raise rates as inflation in their countries moved well above target ranges. Indonesia and Korea were next in line to tighten policy, albeit for different combinations of concern. Indonesia hiked due to FX‑stability worries and imported inflationary pressures, while Korea’s strong exports growth, overheating property market and stellar semiconductor sector earnings raised concerns of spillover demand pressures. Singapore and Japan also tightened policy as part of broader normalisation rather than acute inflation fighting.
Figure 3: Inflation versus targets across Asia
Click the image to enlarge
Source: HSBC AM, Bloomberg, May 2026
Governments, meanwhile, have leaned on subsidies and price controls to blunt the immediate impact of higher fuel costs, but the fiscal burden is beginning to strain. Thailand has suspended some subsidies as deficits widened, India has begun lifting caps on petrol and diesel, and Indonesia plans to maintain fuel subsidies at the cost of cuts elsewhere to meet deficit targets. The key risk is that persistent energy shocks eventually spill over into broader prices and services, unanchoring inflation expectations if central banks move too slowly, or undermining growth if they respond too aggressively.
Structural themes in Asia
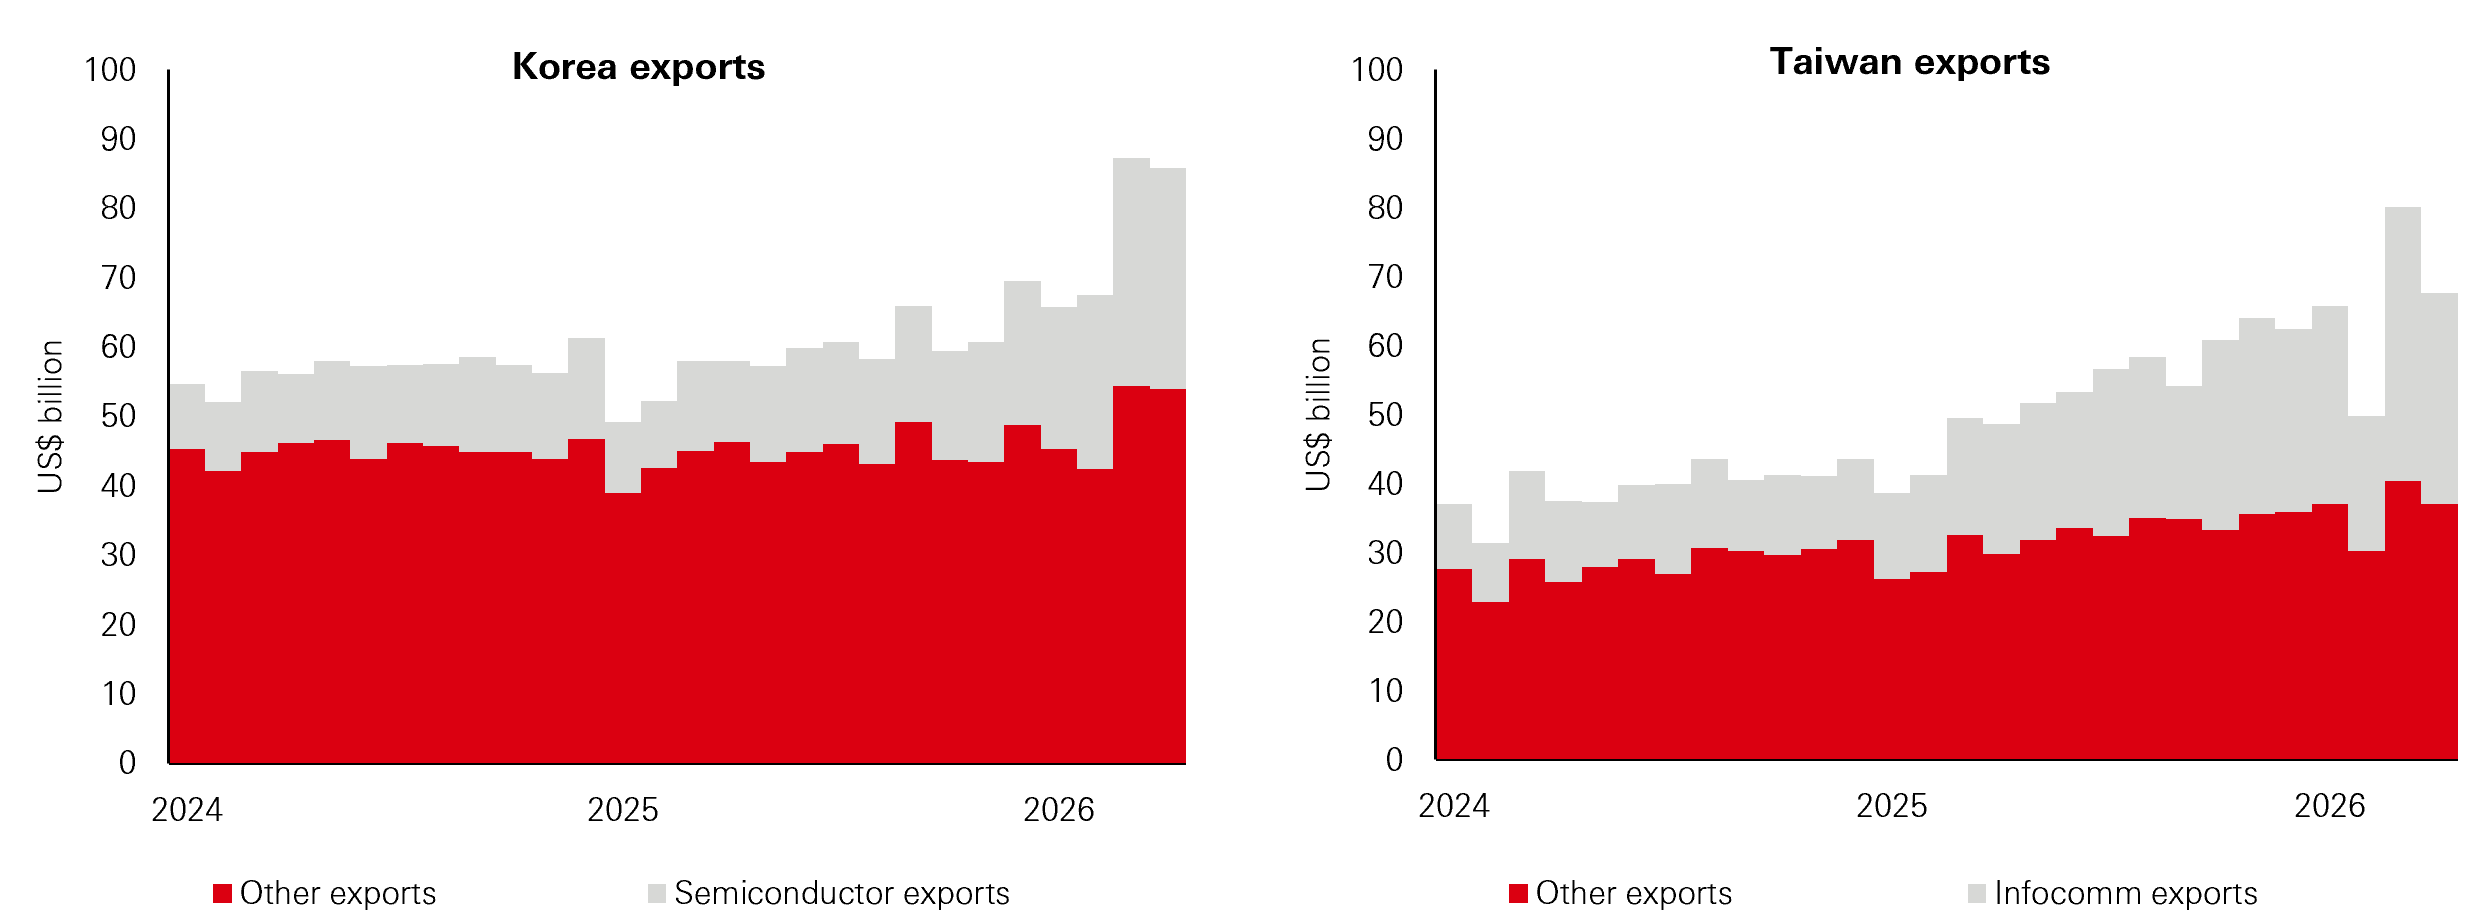
The Middle East conflict is not the only driving force for Asian markets. There are several structural themes that are reshaping Asia’s medium‑term investment landscape. The AI and semiconductor cycle has become a major driver of exports and growth for Korea and Taiwan, while electronics exports from Singapore, Malaysia and Thailand have also risen sharply over the past two years, supporting activity.
Figure 4: Semiconductor becoming more prominent exports in Asia
Click the image to enlarge
Source: HSBC AM, Bloomberg, April 2026.
Up the value chain, US hyperscalers’ capex plans and strong cloud revenue growth are reinforcing confidence in the monetisation of AI investment. Further downstream, AI diffusion among end users remains far below the penetration of smartphones and the internet, suggesting substantial runway for adoption. In China, new industries such as AI hardware, batteries, EVs, renewables and biotech are attracting significant investor attention and policy support, with related indices outperforming the broader market.
Implications for multi-asset investors
Modelling what the energy shock could mean for different parts of the Asian market involves taking into consideration several key factors: Middle East tension exposure, macro fundamentals, idiosyncratic catalysts and recovery potential.
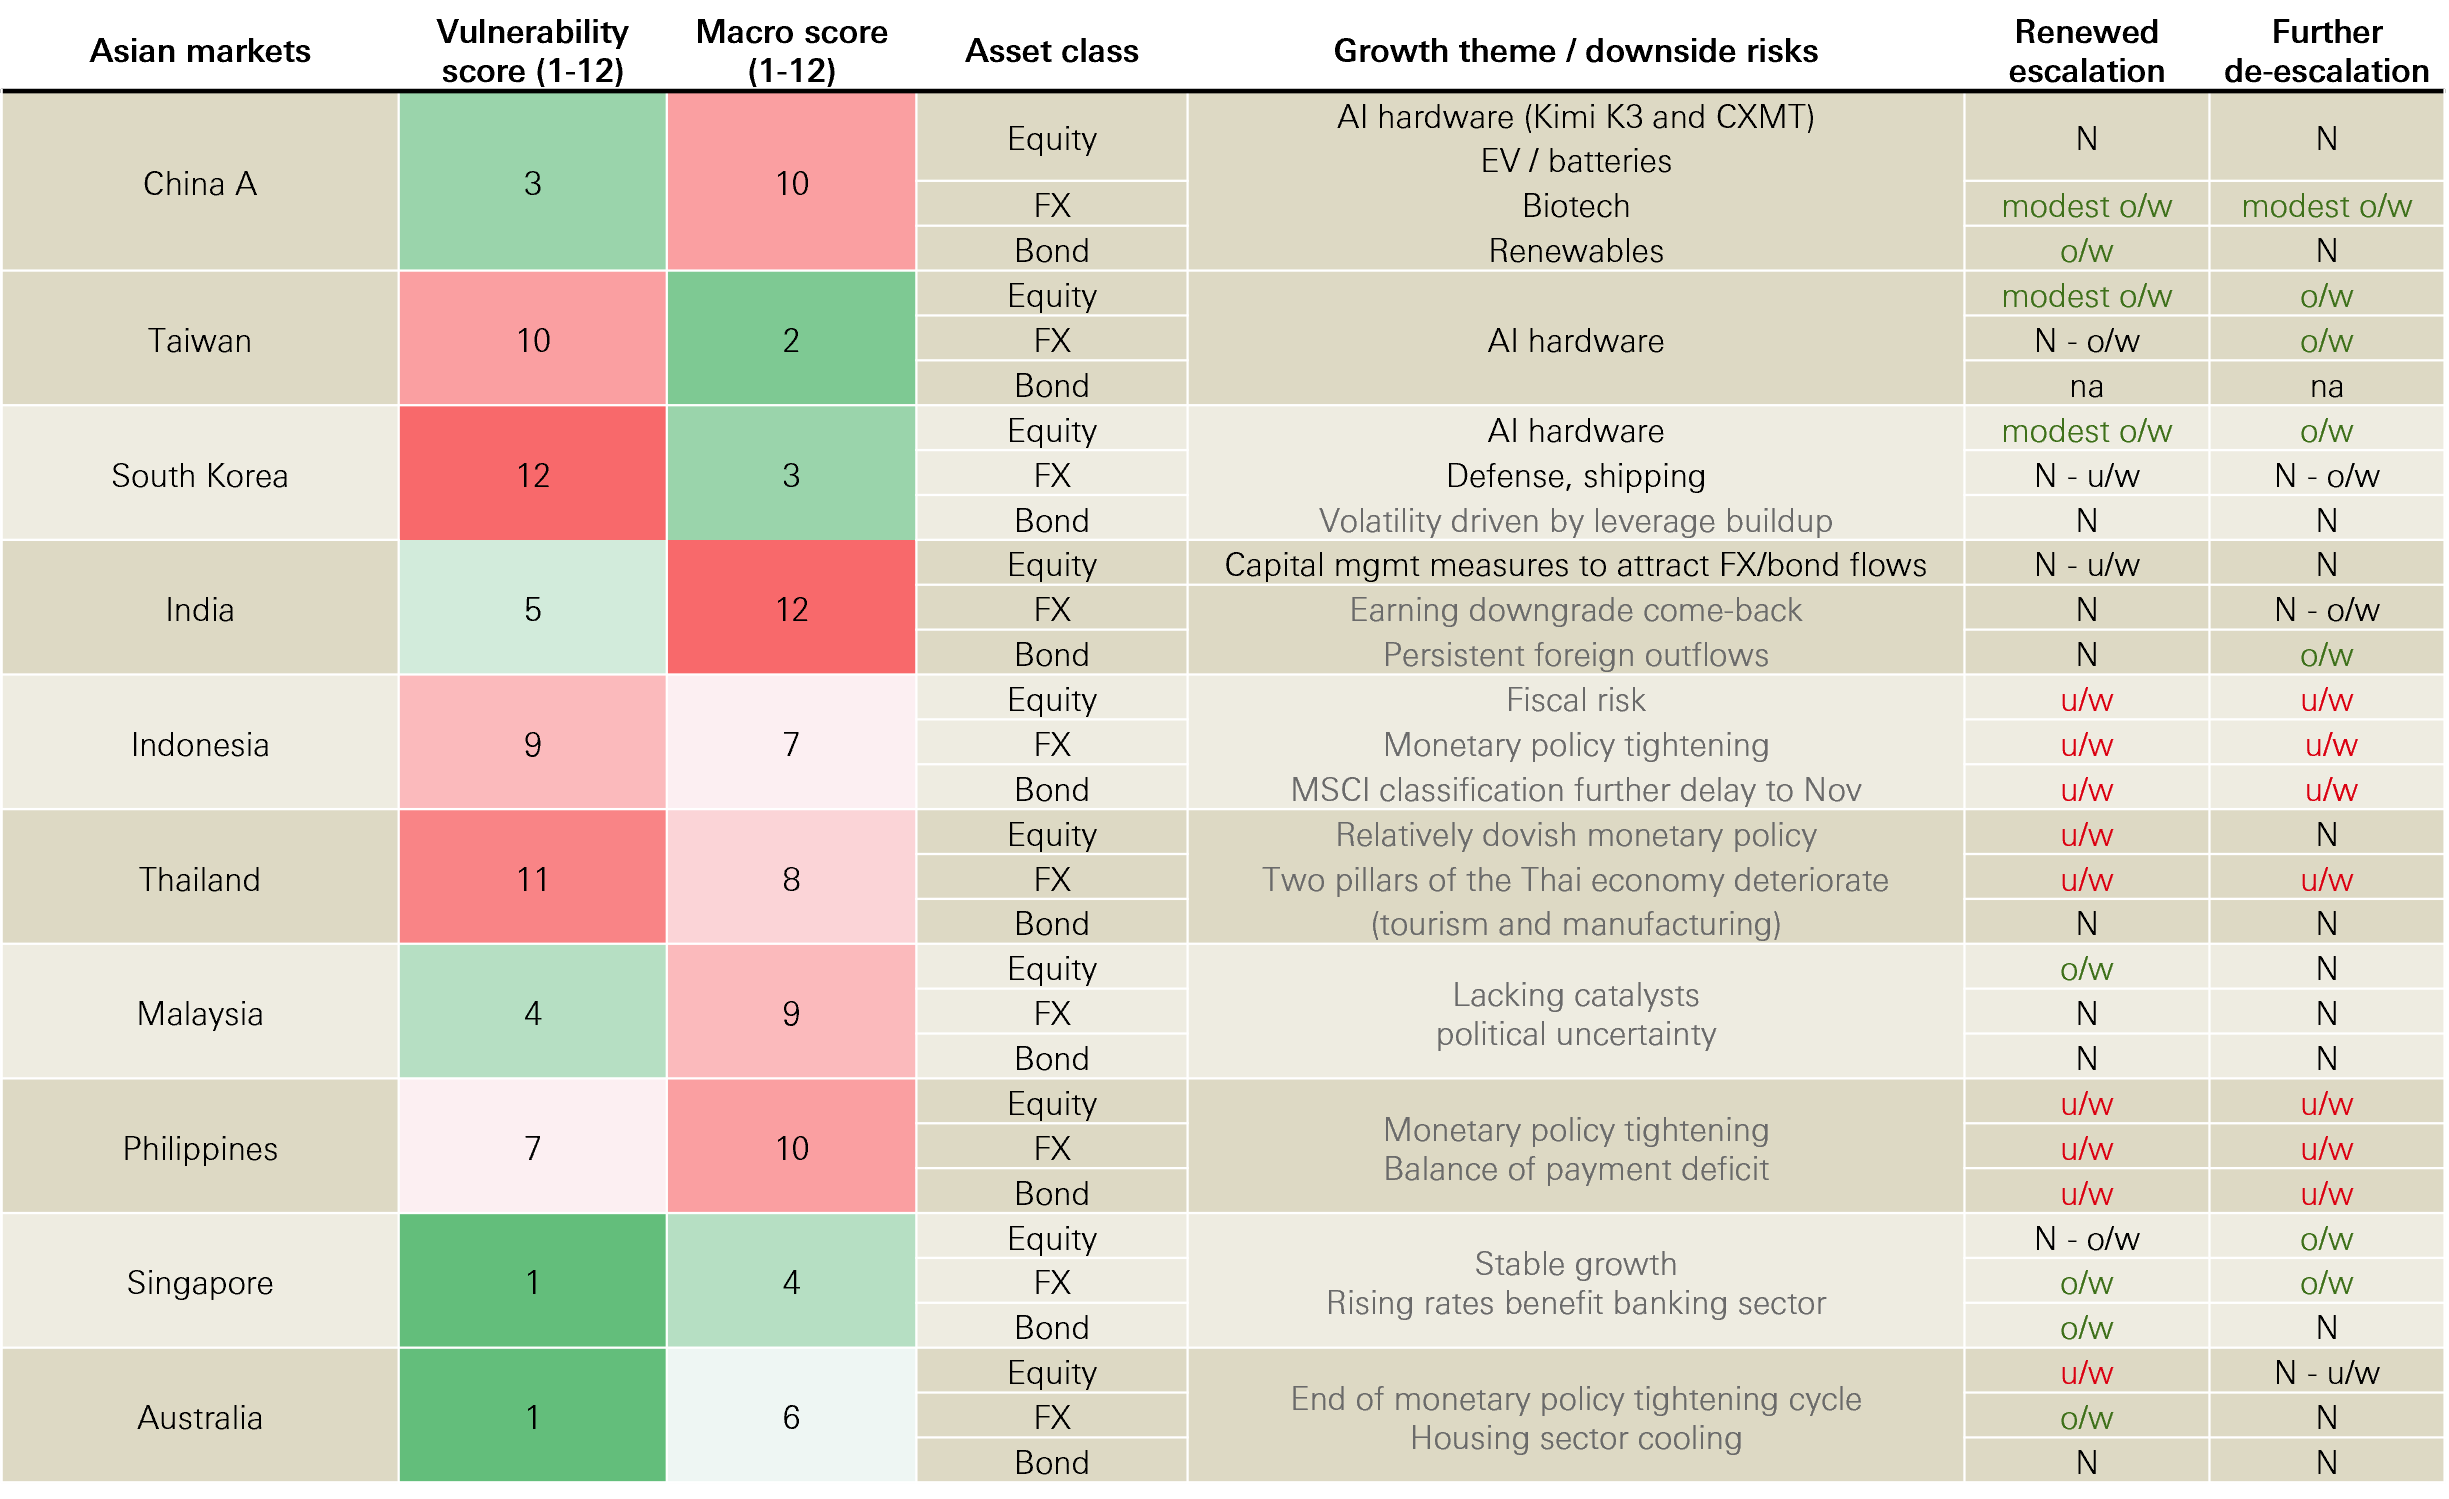
It is notable that the moves in the war so far have seen a broad-based sell-off in Asian assets – with equities being the most sensitive – when the Middle East conflict showed signs of escalation. When there was more optimism about a ceasefire, the rebound was narrower, emphasising the importance of selection in Asian markets.
Figure 5: Asian asset returns – escalation versus de-escalation windows
Click the image to enlarge
Source: HSBC Asset Management. Data as of July 2026. The vulnerability and macro scores are compiled using proprietary methods. The vulnerability score comprises a mix of fundamental metrics that measure an economy’s dependence on imported oil, several equity market metrics related to oil price sensitivity and other variables related to market stress. The macro score is created using a blend of common macroeconomic indicators such as such as fiscal balance, debt levels, financial conditions, etc.
The conflict has repeatedly raised hopes of a lasting ceasefire, only for them to fade, and the ultimate outcome remains uncertain. In a firm de-escalation scenario, our analysis suggests that Taiwanese and Korean equities would be clear outperformers benefiting from strong AI/tech upcycle. Their high-income status makes the oil shock more manageable in practice. TWD would be a winner given its pro‑cyclical nature and Taiwan’s strong tech exports and current account surplus. KRW would have the potential to rebound as it’s still undershooting strong fundamentals.
The CNY is likely to be a long‑term beneficiary, reflecting the ongoing diversification away from the US dollar and China’s domestic economic rebalancing. However, our enthusiasm has softened somewhat since the People’s Bank of China removed explicit support for the currency from its July policy statement.
Notable losers in a de‑escalation scenario could include Philippine assets. Their vulnerability to AI‑driven disruption, weaker productivity dynamics, and less advantageous position in the global value chain could weigh on sentiment. Indonesian FX and equities may also underperform, given sizable fiscal and current account deficits and ongoing foreign outflows.
Philippine assets are similarly exposed under a re‑escalation in Middle East tensions. The economy is heavily reliant on crude imports, and further spikes in oil prices would likely widen its twin deficits and force a monetary tightening response. Thailand would face comparable challenges: deteriorating terms of trade, a widening current account deficit, and weaker growth in manufacturing and tourism – the two key pillars of its economy – would pressure both activity and the THB.
China again screens as a relative winner in a re‑escalation scenario. The CNY has proved resilient during recent oil price spikes, as China has drawn on ample oil reserves to buffer the impact. Taiwanese and Korean equities also look well‑positioned, with AI hardware stocks demonstrating an ability to sustain high valuations and robust earnings.
Singapore’s tighter monetary stance should support the SGD and local government bonds, while Australia’s shift towards a more restrictive policy stance is likely to underpin the AUD. Malaysian equities would also appear more attractive relative to local bonds and the MYR.
To complement this scenario analysis, we also backtested a trade basket that goes long the identified ‘winners’ and short the ‘losers,’ constructed using a risk‑parity approach across asset classes and calibrated to a 1 per cent tracking error.1 Over the escalation periods in 2022 and 2026, this basket outperformed both the broader Asia ex‑Japan equity index and the Asia local‑currency bond index.
Conclusion
Taken together, the Middle East conflict has clearly raised the risk premium on Asian assets via energy, supply and policy channels, but its impact is being filtered through a region that is simultaneously benefiting from powerful structural drivers in technology and energy transition. The resulting picture is one of heightened dispersion – between exporters and importers, stronger and weaker balance sheets, and cyclical pressures and structural growth – which is likely to remain a defining feature of Asian markets as the geopolitical backdrop evolves.
Continue reading:
Shifting plates of structural themes
For informational purposes only and should not be construed as a recommendation to invest in the specific country, product, strategy, sector or security. The views expressed above were held at the time of preparation and are subject to change without notice. Any forecast, projection or target where provided is indicative only and not guaranteed in any way. HSBC Asset Management accepts no liability for any failure to meet such forecast, projection or target.
Source: HSBC Asset Management, August 2026.
1. Source: Bloomberg. Back-testing dates are 24 February 2022-8 June 2022, and 27 February 2026-7 April 2026. Simulated data is shown for illustrative purposes only and does not predict future returns. Simulations are based on Back Testing assuming that the optimisation models and rules in place today are applied to historical data. As with any mathematical model that calculates results from inputs, results may vary significantly according to the values inputted. Prospective investors should understand the assumptions and evaluate whether they are appropriate for their purposes. Some relevant events or conditions may not have been considered in the assumptions. Actual events or conditions may differ materially from assumptions.
Past performance does not predict future returns. For informational purposes only and should not be construed as a recommendation to invest in the specific country, product, strategy, sector or security. The views expressed above were held at the time of preparation and are subject to change without notice. Any forecast, projection or target where provided is indicative only and not guaranteed in any way. HSBC Asset Management accepts no liability for any failure to meet such forecast, projection or target.
Important information
For Professional Clients and intermediaries within countries and territories set out below; and for Institutional Investors and Financial Advisors in the US. This document should not be distributed to or relied upon by Retail clients/investors.
The value of investments and the income from them can go down as well as up and investors may not get back the amount originally invested. The performance figures contained in this document relate to past performance, which should not be seen as an indication of future returns. Future returns will depend, inter alia, on market conditions, investment manager’s skill, risk level and fees. Where overseas investments are held the rate of currency exchange may cause the value of such investments to go down as well as up. Investments in emerging markets are by their nature higher risk and potentially more volatile than those inherent in some established markets. Economies in emerging markets generally are heavily dependent upon international trade and, accordingly, have been and may continue to be affected adversely by trade barriers, exchange controls, managed adjustments in relative currency values and other protectionist measures imposed or negotiated by the countries and territories with which they trade. These economies also have been and may continue to be affected adversely by economic conditions in the countries and territories in which they trade.
The contents of this document may not be reproduced or further distributed to any person or entity, whether in whole or in part, for any purpose. All non-authorised reproduction or use of this document will be the responsibility of the user and may lead to legal proceedings. The material contained in this document is for general information purposes only and does not constitute advice or a recommendation to buy or sell investments. Some of the statements contained in this document may be considered forward looking statements which provide current expectations or forecasts of future events. Such forward looking statements are not guarantees of future performance or events and involve risks and uncertainties. Actual results may differ materially from those described in such forward-looking statements as a result of various factors. We do not undertake any obligation to update the forward-looking statements contained herein, or to update the reasons why actual results could differ from those projected in the forward-looking statements. This document has no contractual value and is not by any means intended as a solicitation, nor a recommendation for the purchase or sale of any financial instrument in any jurisdiction in which such an offer is not lawful. The views and opinions expressed herein are those of HSBC Asset Management at the time of preparation and are subject to change at any time. These views may not necessarily indicate current portfolios' composition. Individual portfolios managed by HSBC Asset Management primarily reflect individual clients' objectives, risk preferences, time horizon, and market liquidity. Foreign and emerging markets: investments in foreign markets involve risks such as currency rate fluctuations, potential differences in accounting and taxation policies, as well as possible political, economic, and market risks. These risks are heightened for investments in emerging markets which are also subject to greater illiquidity and volatility than developed foreign markets. This commentary is for information purposes only. It is a marketing communication and does not constitute investment advice or a recommendation to any reader of this content to buy or sell investments nor should it be regarded as investment research. It has not been prepared in accordance with legal requirements designed to promote the independence of investment research and is not subject to any prohibition on dealing ahead of its dissemination. This document is not contractually binding nor are we required to provide this to you by any legislative provision.
All data from HSBC Asset Management unless otherwise specified. Any third-party information has been obtained from sources we believe to be reliable, but which we have not independently verified. HSBC Asset Management is the brand name for the asset management business of HSBC Group, which includes the investment activities that may be provided through our local regulated entities. HSBC Asset Management is a group of companies in many countries and territories throughout the world that are engaged in investment advisory and fund management activities, which are ultimately owned by HSBC Holdings Plc. (HSBC Group).
- In Australia, this document is issued by HSBC Bank Australia Limited ABN 48 006 434 162, AFSL 232595, for HSBC Global Asset Management (Hong Kong) Limited ARBN 132 834 149 and HSBC Global Asset Management (UK) Limited ARBN 633 929 718. This document is for institutional investors only and is not available for distribution to retail clients (as defined under the Corporations Act). HSBC Global Asset Management (Hong Kong) Limited and HSBC Global Asset Management (UK) Limited are exempt from the requirement to hold an Australian financial services license under the Corporations Act in respect of the financial services they provide. HSBC Global Asset Management (Hong Kong) Limited is regulated by the Securities and Futures Commission of Hong Kong under the Hong Kong laws, which differ from Australian laws. HSBC Global Asset Management (UK) Limited is regulated by the Financial Conduct Authority of the United Kingdom and, for the avoidance of doubt, includes the Financial Services Authority of the United Kingdom as it was previously known before 1 April 2013, under the laws of the United Kingdom, which differ from Australian laws;
- In Bermuda, this document is issued by HSBC Global Asset Management (Bermuda) Limited, of 37 Front Street, Hamilton, Bermuda which is licensed to conduct investment business by the Bermuda Monetary Authority;
- In France, Belgium, Netherlands, Luxembourg, Portugal, Greece, Finland, Norway, Denmark, Spain and Sweden this document is issued by HSBC Global Asset Management (France), a Portfolio Management Company authorised by the French regulatory authority AMF (no. GP99026);
- In Germany, this document is issued by HSBC Global Asset Management (Deutschland) GmbH which is regulated by BaFin (German clients) respective by the Austrian Financial Market Supervision FMA (Austrian clients);
- In Hong Kong, this document is issued by HSBC Global Asset Management (Hong Kong) Limited, which is regulated by the Securities and Futures Commission. This content has not been reviewed by the Securities and Futures Commission;
- In India, this document is issued by HSBC Asset Management (India) Pvt Ltd. which is regulated by the Securities and Exchange Board of India;
- In Italy, this document is issued by HSBC Global Asset Management (France), a Portfolio Management Company authorised by the French regulatory authority AMF (no. GP99026), through its Italian branch, regulated by Banca d’Italia and Commissione Nazionale per le Società e la Borsa (Consob);
- In Japan, this document is issued by HSBC Asset Management (Japan) Ltd (JRN 3010001124868), regulated by the Financial Services Agency;
- In Malta, this document is issued by HSBC Global Asset Management (Malta) Limited which is regulated and licensed to conduct Investment Services by the Malta Financial Services Authority under the Investment Services Act;
- In Mexico, this document is issued by HSBC Global Asset Management (Mexico), SA de CV, Sociedad Operadora de Fondos de Inversión, Grupo Financiero HSBC which is regulated by Comisión Nacional Bancaria y de Valores;
- In the United Arab Emirates, this document is issued by HSBC Investment Funds (Luxembourg) S.A. – Dubai Branch (Level 20, HSBC Tower, PO Box 66, Downtown Dubai, United Arab Emirates) regulated by the Capital Market Authority (CMA) in the UAE to conduct investment fund management, portfolios management, fund administration activities (CMA Category 2 license No.20200000336) and promotion activities (CMA Category 5 license No.20200000327).
- In the United Arab Emirates, this document is issued by HSBC Global Asset Management MENA, a unit within HSBC Bank Middle East Limited, U.A.E Branch, PO Box 66 Dubai, UAE, regulated by the Central Bank of the U.A.E. and the Capital Market Authority in the UAE under CMA license number 602004 for the purpose of this promotion and lead regulated by the Dubai Financial Services Authority. HSBC Bank Middle East Limited is a member of the HSBC Group and HSBC Global Asset Management MENA are marketing the relevant product only in a sub-distributing capacity on a principal-to-principal basis. HSBC Global Asset Management MENA may not be licensed under the laws of the recipient’s country of residence and therefore may not be subject to supervision of the local regulator in the recipient’s country of residence. One of more of the products and services of the manufacturer may not have been approved by or registered with the local regulator and the assets may be booked outside of the recipient’s country of residence.
- In Singapore, this document is issued by HSBC Global Asset Management (Singapore) Limited, which is regulated by the Monetary Authority of Singapore. The content in the document/video has not been reviewed by the Monetary Authority of Singapore;
- In Switzerland, this document is issued by HSBC Global Asset Management (Switzerland) AG. This document is intended for professional investor use only. For opting in and opting out according to FinSA, please refer to our website; if you wish to change your client categorization, please inform us. HSBC Global Asset Management (Switzerland) AG having its registered office at Gartenstrasse 26, PO Box, CH-8002 Zurich has a licence as an asset manager of collective investment schemes and as a representative of foreign collective investment schemes. Disputes regarding legal claims between the Client and HSBC Global Asset Management (Switzerland) AG can be settled by an ombudsman in mediation proceedings. HSBC Global Asset Management (Switzerland) AG is affiliated to the ombudsman FINOS having its registered address at Talstrasse 20, 8001 Zurich. There are general risks associated with financial instruments, please refer to the Swiss Banking Association (“SBA”) Brochure “Risks Involved in Trading in Financial Instruments”;
- In Taiwan, this document is issued by HSBC Global Asset Management (Taiwan) Limited which is regulated by the Financial Supervisory Commission R.O.C. (Taiwan);
- In Turkiye, this document is issued by HSBC Asset Management A.S. Turkiye (AMTU) which is regulated by Capital Markets Board of Turkiye. Any information here is not intended to distribute in any jurisdiction where AMTU does not have a right to. Any views here should not be perceived as investment advice, product/service offer and/or promise of income. Information given here might not be suitable for all investors and investors should be giving their own independent decisions. The investment information, comments and advice given herein are not part of investment advice activity. Investment advice services are provided by authorized institutions to persons and entities privately by considering their risk and return preferences, whereas the comments and advice included herein are of a general nature. Therefore, they may not fit your financial situation and risk and return preferences. For this reason, making an investment decision only by relying on the information given herein may not give rise to results that fit your expectations.
- In the UK, this document is issued by HSBC Global Asset Management (UK) Limited, which is authorised and regulated by the Financial Conduct Authority;
- In the US, this document is issued by HSBC Securities (USA) Inc., an HSBC broker dealer registered in the US with the Securities and Exchange Commission under the Securities Exchange Act of 1934. HSBC Securities (USA) Inc. is also a member of NYSE/FINRA/SIPC. HSBC Securities (USA) Inc. is not authorized by or registered with any other non-US regulatory authority. The contents of this document are confidential and may not be reproduced or further distributed to any person or entity, whether in whole or in part, for any purpose without prior written permission.
- In Chile, operations by HSBC's headquarters or other offices of this bank located abroad are not subject to Chilean inspections or regulations and are not covered by warranty of the Chilean state. Obtain information about the state guarantee to deposits at your bank or on www.cmfchile.cl;
- In Colombia, HSBC Bank USA NA has an authorized representative by the Superintendencia Financiera de Colombia (SFC) whereby its activities conform to the General Legal Financial System. SFC has not reviewed the information provided to the investor. This document is for the exclusive use of institutional investors in Colombia and is not for public distribution;
- In Costa Rica, the Fund and any other products or services referenced in this document are not registered with the Superintendencia General de Valores (“SUGEVAL”) and no regulator or government authority has reviewed this document, or the merits of the products and services referenced herein. This document is directed at and intended for institutional investors only.
- In Peru, HSBC Bank USA NA has an authorized representative by the Superintendencia de Banca y Seguros in Perú whereby its activities conform to the General Legal Financial System - Law No. 26702. Funds have not been registered before the Superintendencia del Mercado de Valores (SMV) and are being placed by means of a private offer. SMV has not reviewed the information provided to the investor. This document is for the exclusive use of institutional investors in Perú and is not for public distribution;
- In Uruguay, operations by HSBC's headquarters or other offices of this bank located abroad are not subject to Uruguayan inspections or regulations and are not covered by warranty of the Uruguayan state. Further information may be obtained about the state guarantee to deposits at your bank or on www.bcu.gub.uy.
Copyright © HSBC Global Asset Management Limited 2026. All rights reserved. No part of this publication may be reproduced, stored in a retrieval system, or transmitted, on any form or by any means, electronic, mechanical, photocopying, recording, or otherwise, without the prior written permission of HSBC Asset Management.
Content ID: D076974; Expiry date: 31.07.2027